In the world of private equity, TVPI (Total Value to Paid-In Capital) is arguably the most important number on any performance report. It cuts through the noise to give you a fund's total value—what’s already been paid back to investors plus what’s left in the portfolio—all measured against the money put in.
What Is TVPI in Private Equity

Here’s a simple analogy. Imagine you're flipping a classic car. The money you sink into buying the car, sourcing parts, and paying for labor is your Paid-In Capital.
Let's say you sell the original engine and some spare parts along the way. That cash you pocket is the realized value—it's money back in your hand.
Meanwhile, the partially restored car sitting in your garage has a market value, even if you haven't sold it yet. That's the unrealized value, the on-paper worth of your remaining investment.
TVPI bundles all of this into a single, straightforward multiple. It answers the one question every investor, or Limited Partner (LP), really cares about: "For every dollar I've put in, how much have you generated in total value?"
The Two Core Components of TVPI
To really get TVPI, you have to look at its two building blocks. Together, they tell the complete story of a fund's performance.
- Realized Value (DPI): Think of this as the "cash-in-hand" component. It’s the sum of all actual distributions, whether cash or stock, that have been returned to LPs. It's the tangible profit.
- Unrealized Value (RVPI): This is the "on-paper" side of the equation. It represents the current fair market value of the investments the fund still holds. This is the future potential that hasn't been cashed out yet.
Both General Partners (GPs) and LPs watch TVPI closely because it gives a comprehensive snapshot of a fund’s health at any given moment. To put it in perspective, 2023 data from sources like callan.com showed top-quartile private equity funds hitting an average TVPI of 2.1x. That means every dollar invested turned into $2.10 of total value.
A high TVPI is a badge of honor—it's critical for future fundraising and proves a manager's ability to create value. It also helps GPs decide when to hold onto an asset or when it’s the right time to sell. For a deeper dive into tracking performance, you might also find our guide on smart KPI setup for VC portfolio monitoring helpful.
How to Calculate the TVPI Formula
Alright, let's move from theory to practice. Calculating TVPI in private equity is actually quite simple once you get a handle on the moving parts. The whole thing boils down to a single formula that weighs what's been paid back, what's left in the portfolio, and what was put in to begin with.
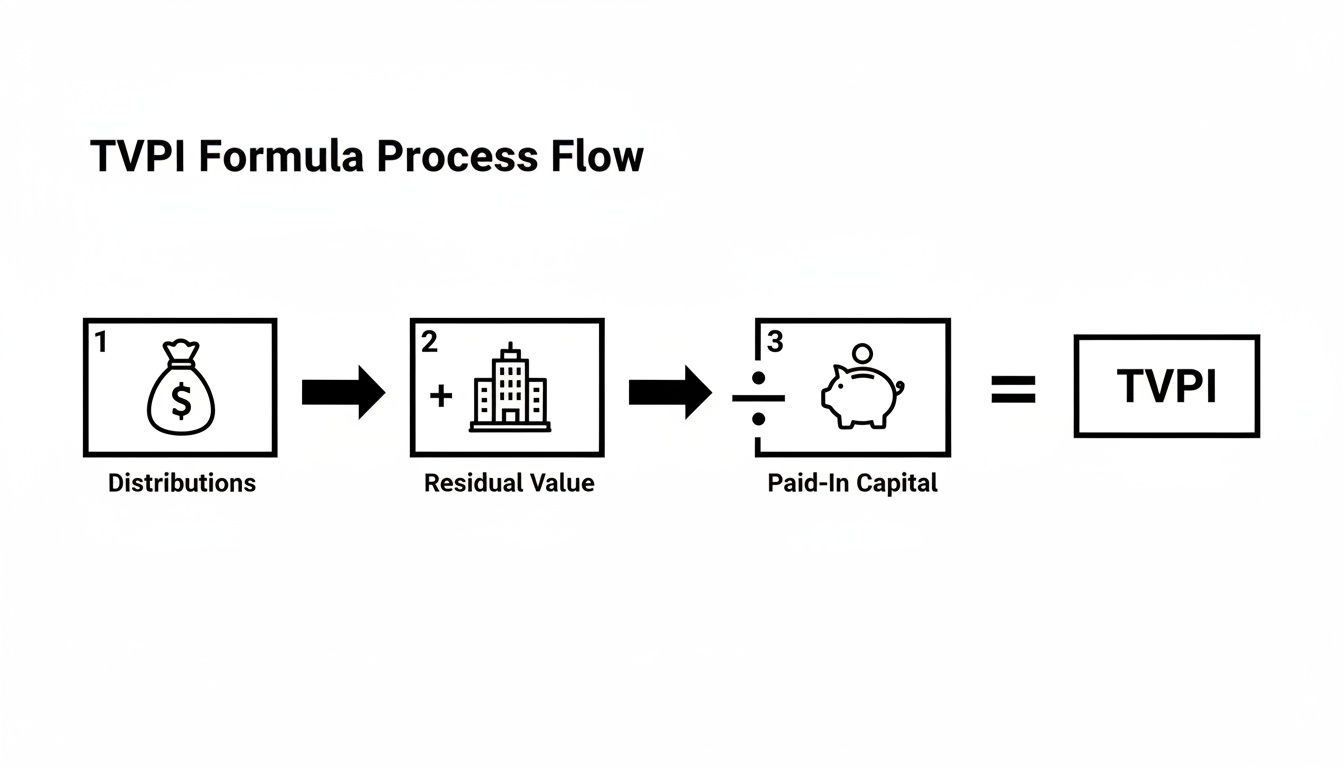
The formula you need to know is:TVPI = (Cumulative Distributions + Residual Value) / Paid-In Capital
Think of each component as a chapter in the fund's story. Cumulative Distributions are the hard cash returned to investors—the realized wins. Residual Value is the "on-paper" worth of the companies still in the portfolio. And Paid-In Capital is the total amount of cash the fund has called from its investors. When you put them all together, you get a full picture of the fund's performance to date.
A Step-by-Step TVPI Calculation Example
To really make this click, let's walk through an example with a hypothetical fund—we'll call it ‘Growth Fund I.’ By seeing the numbers in action, you can get a feel for how the formula plays out in the real world.
Let's say Growth Fund I is five years into its life and its financials look like this:
- Paid-In Capital (PIC): Limited Partners have contributed a total of $50 million over the years through various capital calls. This is the foundation of our calculation—the denominator.
- Cumulative Distributions (DPI): The fund has already sold two of its portfolio companies, returning a cool $30 million in cash back to its LPs. This is the realized, "in-the-bank" part of the return.
- Residual Value (RVPI): The remaining investments in the portfolio are currently valued at $60 million, based on the most recent quarterly valuation. This is the unrealized, or on-paper, value.
Now, let's plug these numbers into our TVPI formula.
First, we need to figure out the fund's total value by adding the cash returned to the value of what's left.
- Total Value = Cumulative Distributions + Residual Value
- Total Value = $30 million + $60 million = $90 million
Next, we divide that Total Value by the amount of capital investors originally put in.
- TVPI = Total Value / Paid-In Capital
- TVPI = $90 million / $50 million = 1.8x
So, what does this 1.8x TVPI tell us? It means that for every dollar an LP invested in Growth Fund I, the fund has generated $1.80 in total value. That value is a mix of cash they've already received and the on-paper value of the assets still being managed.
To break this down even clearer, here’s a table showing how we got there.
Hypothetical Fund TVPI Calculation Example
This table provides a step-by-step breakdown for our fictional 'Growth Fund I', illustrating how the TVPI calculation works in a practical scenario.
This example really clarifies the mechanics. Of course, when you're tracking dozens of investments, capital calls, and distributions, doing this manually gets messy fast. Many fund managers find that automating these calculations is essential. If you're still stuck in spreadsheets, you might want to explore our guide to improving reporting with Excel alternatives.
Reading Between the Lines: How to Interpret TVPI
A TVPI multiple isn’t just another number on a page. Think of it as a fund's overall health report—it gives you a snapshot of its performance and potential, but you need to know how to read it to get the full story.
At its core, TVPI answers a simple question: is the fund making money?
- TVPI > 1.0x: Great news. The fund's total value—what it has paid back plus what it's still worth—is more than the capital LPs put in. It's on track to be profitable.
- TVPI = 1.0x: The fund is at the break-even point. The value of its holdings and distributions equals the initial investment. No profit, but no loss either.
- TVPI < 1.0x: This is a red flag. The fund is "underwater," meaning its total value is less than the capital invested. It's currently in a loss position.
This simple breakdown shows how TVPI combines realized cash with unrealized potential to give a complete picture.
As the visual shows, it’s a holistic metric. It captures both the cash in your pocket (Distributions) and the promise of future returns (Residual Value), all measured against the capital you committed.
Context is King in TVPI Analysis
But here's where experience comes in: a "good" TVPI is never an absolute number. A 1.5x TVPI could be fantastic or terrible—it all depends on the context. To really understand what you're looking at, you have to consider the fund's vintage year, where it is in its lifecycle, and its core investment strategy.
For instance, a young fund that's only two years in will naturally have a low TVPI. It's busy deploying capital, and its portfolio companies are still growing. On the flip side, a ten-year-old fund nearing the end of its life should have a much higher TVPI, with a large chunk of that value already returned to investors as cash (a high DPI).
A fund's strategy also dictates what a "normal" TVPI looks like. Venture capital funds play a high-risk, high-reward game, so you'll see a huge range of outcomes. In contrast, buyout funds tend to follow a more predictable growth curve, leading to steadier TVPIs over time.
Benchmarking Against the Market
No fund operates in a vacuum. To truly gauge performance, you need to see how it stacks up against its peers. Historical data is your best friend here.
For example, recent data shows that North American buyout funds from the 2015-2020 vintages hit a strong average TVPI of 1.95x, beating European funds, which came in at 1.72x. This tells you that geography and market conditions matter. You only need to look at funds from the 2008 financial crisis to see how a tough economic climate can weigh down returns for years. You can dig deeper into these historical TVPI benchmarks and insights to get a feel for the landscape.
Ultimately, interpreting TVPI is about looking beyond the headline number. You have to ask the right questions. How much of that multiple is cold, hard cash (DPI) versus just "paper" gains (RVPI)? After all, a 2.0x TVPI driven mostly by unrealized value is a very different beast than a 2.0x TVPI where most of the value has already been distributed. That nuance is the key to seeing what’s really going on.
Understanding TVPI vs. DPI vs. IRR
While TVPI in private equity gives a fantastic snapshot of a fund's total value, it doesn't tell the whole story on its own. To really get a grip on fund performance, you have to look at it alongside its two closest relatives: DPI (Distributions to Paid-In Capital) and IRR (Internal Rate of Return).
Think of it like getting a personal fitness assessment. TVPI is your overall health score—a combination of your current wellness and future potential. DPI is the tangible result of your workouts, like the weight you can actually lift today. And IRR? That’s your metabolic rate, measuring how quickly and efficiently you’re generating those results over time.
The Performance Metric Trio
Each of these metrics answers a different, but equally important, question about how a fund is doing. Relying on just one can give you a pretty skewed picture.
- TVPI (Total Value): Asks, "For every dollar I've put in, what's the total worth of my investment, counting both realized cash and the value of what's left?"
- DPI (Realized Value): Asks, "For every dollar I've put in, how much cash have I actually gotten back in my pocket?"
- IRR (Time-Weighted Return): Asks, "How fast is my money growing, taking into account the timing of all the cash flows?"
A young fund, for example, might show a flashy IRR early on from a quick win, but its DPI will be low because actual cash hasn't been sent back to investors yet. On the flip side, a mature fund might have a more modest IRR but a strong DPI, proving it has successfully returned capital.
TVPI is the bridge between these two worlds. It combines the realized certainty of DPI with the unrealized future potential that drives IRR, offering a balanced, holistic view of performance at a specific point in time.
TVPI vs. DPI vs. IRR A Comparative Overview
To make sense of how these three key metrics work together, it's helpful to see them side-by-side. Each provides a unique lens through which to view a fund's health and progress.
Ultimately, no single metric is perfect. Using them together allows you to build a multi-dimensional and far more accurate picture of a fund's true performance.
Why Context Matters So Much
The interplay between these metrics is where the real story is told. For instance, private equity returns aren't evenly distributed. Bain’s 2025 outlook shows top-decile funds hitting an incredible 3.2x TVPI, while median funds are closer to 1.25x, and a full 20% are underwater.
To get a more nuanced picture, KKR's 2016-2020 vintages achieved a 2.15x net TVPI by late 2024, which breaks down into a solid DPI of 0.95x and a healthy residual value. You can find more details about these fund performance trends on carta.com.
This context is everything. A high TVPI without a respectable DPI can be a red flag that returns are still just "on paper." At the same time, a strong IRR can be misleading if it’s based on small, early distributions. By looking at TVPI, DPI, and IRR together, both LPs and GPs can get a much clearer, more honest understanding of a fund’s journey.
How Portfolio Intelligence Platforms Automate TVPI
If you've ever found yourself wrestling with spreadsheets to calculate TVPI, you know the pain. It’s a tedious, manual slog of pulling data from a dozen different places. Not only does it eat up valuable time, but it’s also a minefield for human error. One bad formula or an old number, and your entire performance picture is thrown off.
This constant data-wrangling keeps finance teams stuck in a reactive loop. Instead of digging into what the numbers actually mean, they spend most of their time just trying to get the report right. It’s an inefficient process that only gets worse as the fund grows, turning timely, reliable reporting into a major headache.
Shifting From Manual Labor to Real-Time Insight
This is exactly the problem that portfolio intelligence platforms were built to solve. Think of them as a central hub—a single source of truth that consolidates all your fund and portfolio company data. By automatically pulling information from accounting systems, bank feeds, and other sources, they completely do away with the manual grunt work.
This automation flows directly into your performance metrics. The software calculates TVPI, DPI, and IRR on the fly, giving you a live, accurate pulse on your fund's health. What used to take days of spreadsheet gymnastics now shows up instantly on a dashboard.
This diagram illustrates how a modern platform connects the dots, from raw data input all the way to automated reporting.
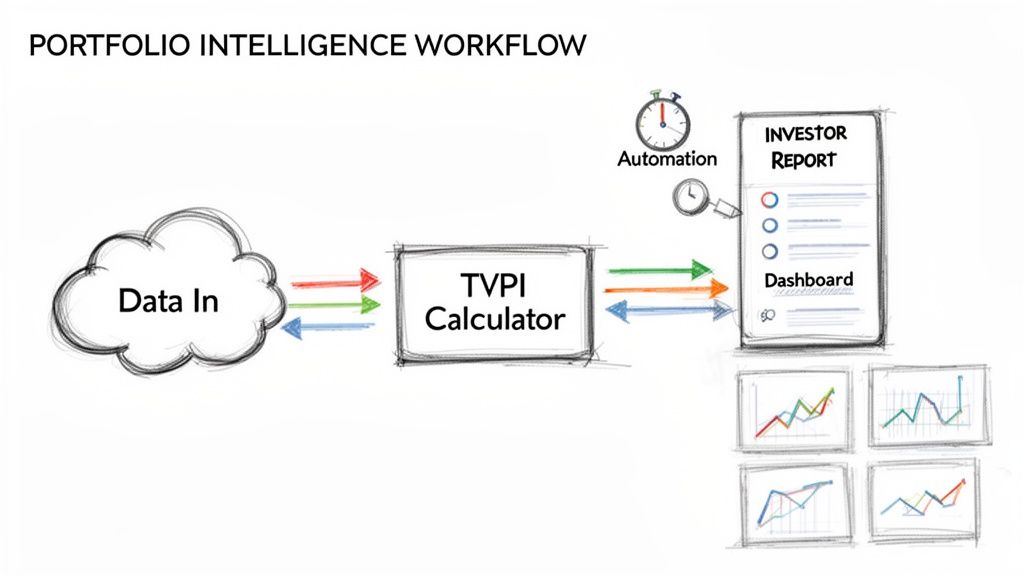
The real magic is the seamless transition from data to intelligence. It removes the bottlenecks that have always plagued manual processes.
The Strategic Benefits of Automation
Switching to a dedicated platform is about more than just saving time; it fundamentally changes how your finance and investment teams operate.
- Superior Accuracy: Automation drastically reduces the risk of human error. Every TVPI private equity calculation is based on verified, current data, which is crucial for building and maintaining trust with your LPs.
- Massive Time Savings: Think about the hundreds of hours your team will get back. That’s time they can re-invest in high-value strategic analysis instead of being buried in data entry.
- Effortless Reporting: Need an ILPA-compliant statement or a custom report for an LP? It’s just a few clicks away. Generating investor-grade reports becomes an on-demand function, not a quarterly fire drill.
By swapping a tangled web of spreadsheets for a purpose-built tool, fund managers can finally get out of the weeds. You move from being a reactive data gatherer to a proactive advisor, using live insights to make better decisions.
This shift means GPs can instantly answer critical questions about fund performance and LP exposure. If you're ready to make that leap, exploring a dedicated portfolio management software is a great first step. The goal is to stop just reporting the numbers and start understanding the story they tell.
Answering Your Top Questions About TVPI
Even after you've got the basics down, a few common questions always seem to pop up when putting TVPI to work in the real world. Let's tackle the most frequent ones to clear up any lingering confusion and sharpen your practical understanding of this key metric.
Can a Fund's TVPI Actually Go Down?
Yes, absolutely. It's a common misconception that TVPI only moves in one direction. While everyone hopes for a steady upward climb as portfolio companies grow, a fund's TVPI can—and often does—take a dip.
This usually happens when the fair market value of the fund's remaining, unrealized investments gets written down. A market correction, a slump in a specific industry, or a key portfolio company missing its targets can all trigger a valuation haircut. A drop in TVPI is a stark reminder that unrealized value is still just "paper value" and shows why it’s so important to watch how the multiple is composed over time.
What’s the Real Difference Between MOIC and TVPI?
You'll often hear the terms MOIC (Multiple on Invested Capital) and TVPI used interchangeably, but there's a subtle yet critical difference between them. Think of MOIC as a deal-level metric. It measures the total value of a single investment against the capital put into that specific company.
TVPI, on the other hand, is a fund-level metric. Its denominator is Paid-In Capital, which is every dollar LPs have contributed to the fund for all investments, fees, and expenses. This makes TVPI the more accurate and holistic measure for fund performance because it truly reflects the LP's total cash commitment.
The bottom line: MOIC is for a single investment; TVPI is for the entire fund. They’re conceptually similar, but using the right term is crucial for clear and professional LP communication.
Why Are LPs So Focused on the DPI Component of TVPI?
Limited Partners laser-focus on DPI (Distributions to Paid-In Capital) for one simple reason: it’s real money back in their pockets. A high TVPI looks great on paper, but if it's almost entirely made up of unrealized value (RVPI), it's still just a promise.
DPI is proof. It demonstrates that the General Partner doesn't just have a knack for picking winners but can also successfully exit those investments and return hard cash to their investors. As a fund gets older, LPs expect to see the TVPI shift from being heavy on RVPI to being dominated by DPI. This transition is the ultimate confirmation that potential value has successfully been turned into realized profit.
Turn your fragmented fund data into your most powerful strategic asset. Vestberry provides a single source of truth for VCs and PEs, automating TVPI calculations and delivering the portfolio intelligence you need to make faster, data-backed decisions. Discover how Vestberry can transform your operations.

