When you hear people talk about private equity performance, the first metric that almost always comes up is the internal rate of return, or IRR. It's the gold standard for a reason: it measures the annualized profitability of an investment while accounting for the complex, uneven timing of cash flows that are the hallmark of private equity.
Unlike buying a public stock, PE investments aren't a simple in-and-out transaction.
Why IRR Is the Core Metric in Private Equity
Think of a private equity fund less like buying a stock and more like building a house from the ground up. You don't pay the builder the full price on day one. Instead, you provide cash in stages: for the foundation, the framing, the plumbing, and so on. Your return isn't a single lump sum either; you might rent out a finished room while the rest of the house is still under construction, generating sporadic income.
This is exactly how private equity works. The fund's lifecycle is a long-term dance of give and take, often stretching over a decade or more.
- Initial Investments (Capital Calls): The fund manager, or General Partner (GP), doesn't take all your committed money at once. They "call" for capital only when they find a promising company to buy.
- Follow-On Investments: As portfolio companies grow, they often need more cash for expansion, leading to further investments down the line.
- Irregular Distributions: Profits are sent back to investors (Limited Partners, or LPs) whenever a portfolio company is sold, which can happen at any point during the fund's life.
A simple return calculation just can't handle this complexity. It completely misses the most important element: time. A dollar returned to you in year three is far more valuable than that same dollar returned in year ten.
Capturing the Time Value of Money
This is precisely where IRR shines. It's built to understand that when money moves is just as important as how much money moves. Technically, IRR is the discount rate that makes the net present value (NPV) of all cash flows—both the money you put in and the money you get out—equal to zero.
Put more simply, it tells you the effective annualized rate at which your investment grew, factoring in the exact timing of every single transaction.
By focusing on the timing of cash flows, IRR provides a standardized way to compare the performance of vastly different private equity deals and funds, each with its own unique investment and distribution schedule.
This is why a 25% IRR is often seen as a benchmark for strong performance in the industry. It's not just a measure of total profit, but a reflection of how efficiently and quickly the GP deployed capital to generate those returns.
Without IRR, trying to compare a venture capital fund that targets quick exits with a buyout fund executing a long-term turnaround would be impossible. It gives everyone a common language to talk about performance in a world defined by long, complex, and illiquid investments.
How To Calculate The Internal Rate of Return
Figuring out the internal rate of return can feel a bit like arcane financial wizardry, but the idea behind it is actually pretty simple. At its core, IRR is the specific discount rate that makes the Net Present Value (NPV) of all cash flows from an investment equal to zero.
Think of it this way: it's the break-even interest rate where the money you put in is perfectly balanced by the money you get out, once you account for the timing of those cash flows. This gets right to the heart of the time value of money—the simple fact that a dollar today is worth more than a dollar tomorrow. A great private equity deal doesn't just return more capital; it returns it faster, and that's exactly what a high IRR tells you.
The calculation itself is essentially solving for the annualized rate of return that considers both the amount and the timing of every single cash flow.
This diagram helps visualize where IRR fits into the lifecycle of a typical PE investment.
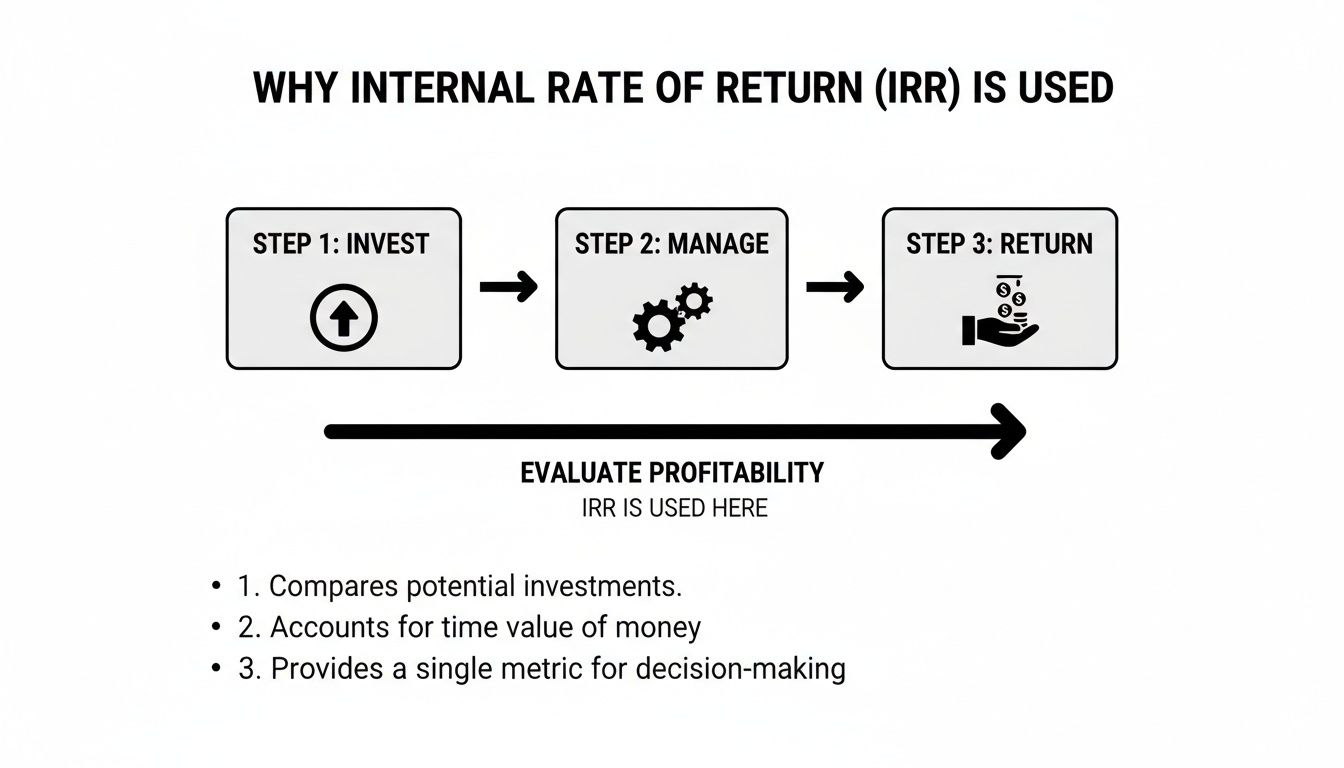
As you can see, the process moves from the initial capital calls to hands-on management and, finally, to distributions. IRR is the scorecard that measures how efficiently that entire cycle converted capital into returns.
A Practical Example Of A Deal IRR Calculation
While the raw math behind IRR involves some complex trial-and-error calculations, thankfully we have tools that do the heavy lifting. Let's walk through a simplified five-year private equity deal to make this tangible.
Imagine a GP invests $10 million into a portfolio company at the start of Year 1. That's our initial cash outflow. Over the next few years, there are some follow-on investments and, eventually, a series of profitable distributions as the company grows and is eventually sold.
Here’s a look at what those cash flows might look like in a table.
Example IRR Calculation for a Single PE Deal
This table breaks down the cash flows for a hypothetical private equity investment, providing the data needed to calculate its IRR.
From this table, we can see the total capital invested was $12 million, and the total cash returned to investors was $25 million. A simple multiple on invested capital (MOIC) would be 2.08x, but that number is missing a huge piece of the puzzle: timing. To understand the speed of the return, we need the IRR.
Introducing XIRR: The PE Professional's Go-To Function
In the real world, private equity cash flows are messy. They don’t stick to a neat annual schedule. Capital gets called when a deal closes, and distributions happen whenever there’s a liquidity event. This is where the standard IRR function in a spreadsheet just won't cut it.
The answer is the XIRR function, which is built into both Microsoft Excel and Google Sheets. This function is purpose-built to handle cash flows that occur at irregular intervals.
The XIRR function is the industry standard because it only needs two inputs: the column of cash flows (both negative and positive) and the exact dates they happened. It automatically does the hard work of accounting for the precise timing of every transaction.
For the example above, plugging the cash flow amounts and their specific dates into the XIRR formula would give you an IRR of 23.9%. This number tells a much more compelling story than the 2.08x multiple. It tells us the investment generated an annualized, time-weighted return of nearly 24% over its entire life—a truly powerful performance metric.
While platforms like Vestberry handle these calculations automatically, any analyst worth their salt needs to understand the mechanics behind XIRR. For those still working in spreadsheets, it's a non-negotiable skill. You can dig deeper into the common challenges and best practices for portfolio reporting in Excel in our separate guide. Getting this right is fundamental to accurately measuring and communicating PE performance.
When people talk about IRR in private equity, it's a bit like talking about cars. Just saying you have one doesn't tell the whole story. Is it a screaming-fast sports car or a workhorse truck built to haul? They’re both vehicles, but they serve entirely different purposes.
It’s the same with IRR. Not all IRR figures are created equal, and knowing the difference is absolutely critical for anyone trying to understand performance. The landscape breaks down into four key variations, and each one tells a different part of the investment story. If you mix them up, you end up comparing apples to oranges, which can lead to some seriously flawed conclusions.
Let's break them down so you can look at any performance report and know exactly what you're seeing.
Gross IRR vs. Net IRR
The first and most fundamental split is between gross IRR and net IRR. The difference is simple but has a massive impact: it's all about whether you’re looking at performance before or after fees.
Gross IRR measures a fund's investment performance before taking out management fees, carried interest (the GP's share of profits), and other fund-level expenses. Think of this as the raw power of the investment engine—it shows how good the manager is at picking and growing companies, pure and simple.
Net IRR, on the other hand, is the return after all those costs have been paid. This is the number that really matters to the Limited Partners (LPs), because it reflects the actual, take-home return on their capital.
This gap between gross and net isn't trivial. According to MSCI data, since 2000, private equity funds have averaged a gross IRR of around 21%. But once you factor in all the fees and carry, that number drops to a net IRR of about 17%. Grasping this distinction is the first step toward a real-world assessment of a fund's performance, a trend explored in articles like this one from Institutional Investor on why private equity continues to outperform.
Deal IRR vs. Fund IRR
Beyond the "before and after fees" question, the next layer is about scope. Are we looking at the performance of one specific investment, or are we measuring the health of the entire portfolio? This is where the difference between Deal IRR and Fund IRR comes in.
Deal IRR zooms in on the cash flows from a single portfolio company. It tells you exactly how that one investment performed, from the day capital was first called to the day it was sold. For GPs, this metric is priceless for figuring out which strategies worked and which deals really moved the needle.
But a fund is always more than the sum of its best deals.
Fund IRR provides the complete picture. It rolls up the cash flows from all investments—the winners and the losers—and also accounts for all fund-level expenses, management fees, and the effect of capital that hasn't been invested yet, often called "cash drag."
Cash drag is a sneaky but powerful factor. If a GP sits on LP capital for too long without putting it to work, that idle cash drags down the fund's overall return, even if the deals themselves are fantastic. A strong Fund IRR proves a manager isn't just a great company-picker, but also a smart and efficient capital allocator.
Comparing Gross, Net, Deal, and Fund IRR
To see how these four metrics fit together, it helps to see them side-by-side. Each offers a different lens for viewing performance, and they are used by different people for different reasons.
In the end, while every type of IRR in private equity has its place, the Net Fund IRR is the north star for investors. It's the one figure that answers the most important question of all: after everything was said and done, what was the real annualized return on my money?
The Common Pitfalls and Limitations of IRR
The internal rate of return is the headline act in private equity performance, but its star power can sometimes mask some serious weaknesses. While a high IRR is always something to celebrate, it can be incredibly misleading if you look at it in a vacuum. Understanding its limitations is just as crucial as knowing how to calculate it.
Think of IRR like a car’s speedometer. It tells you how fast you're going at a particular moment, but it tells you nothing about the total distance you've traveled or if you're even headed in the right direction. Relying on it exclusively can give you a distorted view of an investment's real success. Smart investors know to pop the hood and question what that number actually represents.
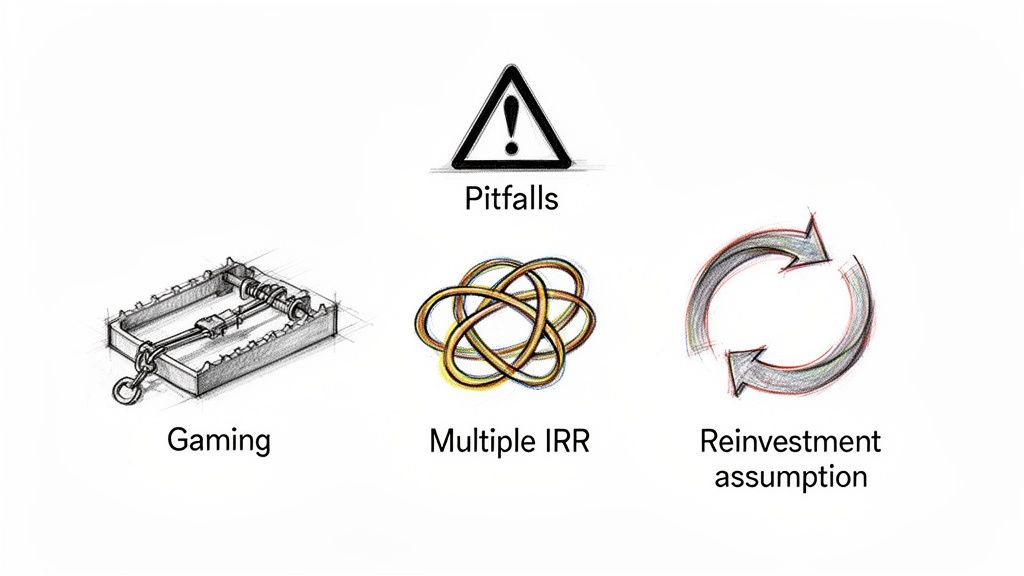
The Reinvestment Rate Myth
One of the most fiercely debated aspects of IRR is the reinvestment rate assumption. There’s a common—and mistaken—belief that the formula assumes all cash distributions are reinvested at the same rate as the IRR itself. So, for a deal with a 30% IRR, this would mean every dollar distributed is immediately put back to work earning 30% annually for the rest of the fund's life.
In reality, this is more of a theoretical ghost than a practical flaw. IRR is just a mathematical result—it’s the discount rate that makes the net present value of all cash flows equal to zero. It doesn't actually assume anything about what you do with your cash once you get it back.
The implication, however, is what matters. It suggests that funds delivering cash back early are superior. This puts pressure on LPs to find new places to park that cash that can generate similarly stellar returns, which, as anyone in the business knows, is far from easy.
The Problem of Multiple IRRs
Another tricky, though less frequent, issue is the potential for multiple IRRs. This mathematical quirk can pop up when an investment has unconventional cash flows—specifically, when the cash flow sign flips more than once (e.g., negative to positive, then back to negative).
Picture this: a fund invests in a company, receives a big distribution, but then has to inject more capital down the line to fund a restructuring. This kind of in-out-in cash flow pattern can produce more than one discount rate that solves the IRR equation. When that happens, the IRR is rendered completely useless. Analysts have to turn to other metrics like MOIC or a modified IRR (MIRR) to get a clear picture.
How Fund Managers Can Game The IRR
Perhaps the most critical limitation is that the internal rate of return in private equity can be manipulated. Because IRR is so sensitive to the timing of cash flows, some financial engineering can artificially pump up the number without actually creating more value for investors.
Here are a couple of common ways it’s done:
- Subscription Lines of Credit: A GP might use a short-term credit line to make an investment instead of calling capital from LPs right away. By delaying that capital call even by just a few months, they shorten the official investment period on paper. This can dramatically boost the calculated IRR, even if the total profit remains exactly the same.
- Quick Flips: A fund might sell a promising company after only a year or two to lock in a fantastic IRR. A 40% IRR from a quick flip looks amazing in a pitch deck, but it might mean leaving a huge amount of long-term value on the table. It often returns less total cash to investors than a longer, more patient hold would have.
These tactics highlight a fundamental weakness: IRR cares more about the speed of returns than the magnitude of profit. A small profit returned quickly can generate a much higher IRR than a massive profit returned over a longer period.
This is exactly why you have to take historical data showing top funds hitting a 39% IRR versus the S&P 500's 12.3% with a grain of salt. While IRR is a powerful way to measure returns from lumpy cash flows, its sensitivity to timing can inflate the perception of performance. You can dig deeper into long-term private equity performance in this insightful analysis.
At the end of the day, IRR is a powerful tool, but it should never be the only tool in your box.
Looking Beyond IRR with Key Performance Metrics
A high IRR can certainly grab your attention, but it never tells the whole story. Relying solely on the internal rate of return is like judging a race car only by its top speed—you're completely missing the picture on its endurance and how it stacks up against the competition. To get a true sense of an investment's success, you need a broader toolkit.
This is where multiples and benchmarks come into play. While IRR is fantastic at showing how quickly and efficiently cash was returned, it can sometimes hide a less-than-impressive reality, like a small profit generated on a lightning-fast deal. By pairing IRR with other key performance indicators, you can build a much more robust, three-dimensional view of performance.
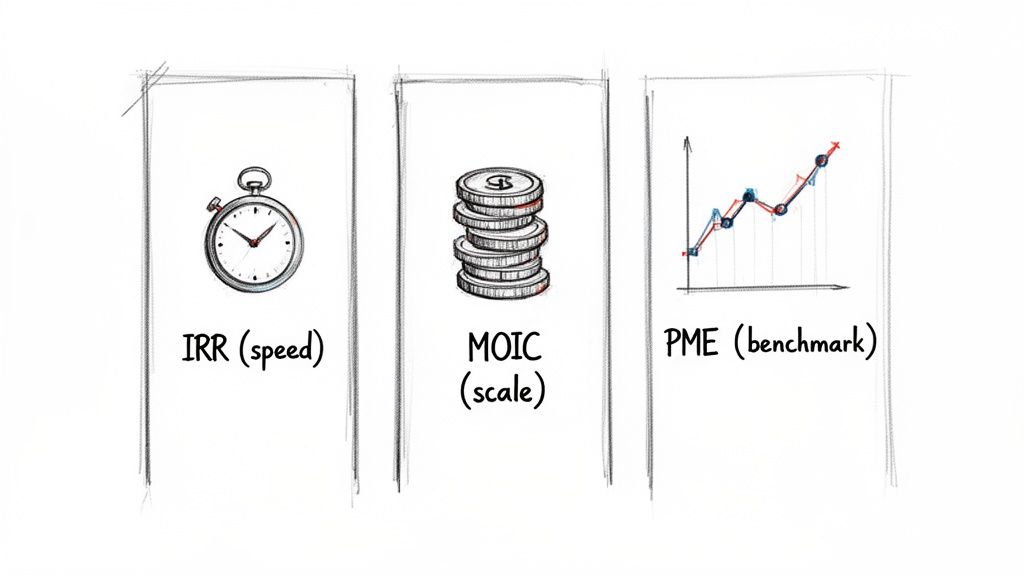
Measuring the Scale of Profit with MOIC, TVPI, and DPI
The most crucial partner to IRR is the Multiple on Invested Capital (MOIC), which is often used interchangeably with Total Value to Paid-In (TVPI). This metric answers a simple but vital question: for every dollar put in, how much total value came out? It’s all about the sheer magnitude of the gain.
A 2.5x MOIC is straightforward—it means that for every $1 million invested, the fund generated $2.5 million in total value, which includes both cash distributions and the current value of any remaining investments.
To get even more specific, TVPI is broken down into two parts:
- Distributions to Paid-In (DPI): This is the "cash-on-cash" return. It measures the hard cash that has actually been returned to LPs. A DPI of 1.0x is a huge milestone; it means investors have gotten their initial investment back.
- Residual Value to Paid-In (RVPI): This represents the value of what's left in the fund—the unrealized investments—as a multiple of the capital contributed.
The formula is simple: DPI + RVPI = TVPI. Early in a fund's life, the value is all in RVPI. As a fund matures and sells its portfolio companies, DPI grows and RVPI shrinks. Any sophisticated KPI setup for portfolio monitoring meticulously tracks these metrics to give a full picture of the fund's health over time.
Benchmarking Against Public Markets with PME
Another essential tool is the Public Market Equivalent (PME). This metric tackles the critical opportunity-cost question: "Could I have done better just by putting my money in a stock market index like the S&P 500?"
PME models, like the common Long-Nickels method, essentially run a simulation. They take the exact same private equity cash flows and "invest" them into a public index. Every capital call "buys" the index, and every distribution "sells" it. The final result tells you whether the private equity fund actually out-earned its public market alternative.
A PME greater than 1.0x means the private equity fund delivered genuine alpha. It generated returns superior to what you could have achieved in the public markets over the same time frame.
Putting It All Together for a Complete Picture
No single number can give you the full story. A sky-high IRR paired with a low TVPI might just be a quick flip that didn't maximize value. On the other hand, a fantastic TVPI with a lackluster IRR could mean a big profit was made, but it took far too long, tying up capital that could have been working elsewhere.
This is exactly why seasoned institutional investors always look at these metrics together. For example, CalPERS, one of the world's largest pension funds, always reports IRR alongside its multiples. A recent filing showed their private equity program had a since-inception net IRR of 11.1% and a 1.5x net multiple—a standard practice that provides a balanced view of both the speed and the scale of returns.
By analyzing IRR, TVPI, DPI, and PME in concert, investors gain a comprehensive understanding that is absolutely essential for making smart capital allocation decisions.
Best Practices for Analyzing IRR Reports
When you’re looking at an internal rate of return in private equity, you have to look past the headline number. A standalone IRR figure, stripped of its context, can easily be more misleading than it is informative.
To get a real handle on performance, investors need to insist on transparency and stick to the best practices championed by organizations like the Institutional Limited Partners Association (ILPA).
The first rule is a simple one: always ask for both gross and net IRR. This isn't just a minor detail; it's a non-negotiable. Gross IRR shows you the fund manager's raw talent at picking winners and generating returns. But net IRR is the bottom line—it’s what Limited Partners (LPs) actually see in their pockets after all the fees, expenses, and carried interest have been taken out. The spread between these two numbers tells you a whole lot about the fund's economics.
Just as critical is the need for benchmarking. A 20% IRR might sound fantastic on its own, but what does it really mean? Without comparing it to its peers, it's just a number floating in a vacuum.
Contextualize Performance with Vintage Year Data
Every fund is a product of its time. The macroeconomic climate a fund invests in—whether it’s a roaring bull market or a deep recession—has a massive impact on its potential returns.
This is exactly why vintage year analysis is so important. It’s the practice of comparing a fund’s IRR only against other funds that began investing in the same year. This creates a true apples-to-apples comparison, stripping away the market noise and giving you a much clearer picture of how skilled a manager really is at navigating a specific economic landscape.
The performance gap between funds can be immense. Historical data reveals a stark dispersion where top-quartile buyout fund IRRs can range from 17.1% to 35.2%, while median returns hover between 9.5% and 12.4%. Transparent, benchmarked reporting is the only way for LPs to identify true outperformers, as detailed in this analysis of private equity's historical success.
The Rise of Technology in IRR Analysis
Let's be honest: manually calculating, checking, and benchmarking IRR across an entire portfolio is a headache. It's complex, time-consuming, and prone to human error. This is where modern portfolio intelligence platforms have become absolutely essential for both General Partners (GPs) and LPs.
These tools do the heavy lifting, automating the complex math behind not just IRR but also TVPI, DPI, and PME. They become the single source of truth, ensuring the data is right and allowing for on-the-fly analysis across different segments of a portfolio.
This screenshot shows how a modern platform visualizes key performance metrics for an LP's entire portfolio.
By pulling all this data into interactive dashboards, both LPs and GPs can instantly see how they’re tracking against benchmarks, pinpoint what's driving value, and make communication a whole lot smoother.
For GPs, it means creating ILPA-compliant reports becomes far more efficient. For LPs, it provides the power to conduct deeper due diligence and make smarter decisions about where to allocate capital. You can discover more about improving LP reporting from an investor's perspective in our detailed guide.
Diving Deeper: Common Questions About Private Equity IRR
The world of private equity IRR is full of nuances. Let's tackle some of the most common questions that come up, cutting through the jargon to give you clear, practical answers.
Why Not Just Use Standard Return Metrics?
Simple return calculations work fine when you buy a stock and sell it later. But private equity is a completely different beast. Investments aren't made in one lump sum, and returns don't come back all at once.
Instead, you have capital calls pulling money in and distributions sending money out at unpredictable times over many years. IRR is built for this exact scenario. It's a time-sensitive metric that understands when cash moves is just as important as how much moves, giving you a true annualized performance figure for these long-term, illiquid investments.
What’s Considered a Good IRR for a PE Fund?
That's the million-dollar question, and the honest answer is: it depends. A "good" IRR is a moving target that hinges on the fund's strategy (a venture fund has different expectations than a buyout fund) and, most importantly, its vintage year—the year it started making investments.
Historically, many top-performing funds have aimed for net IRRs north of 20%. But the real test is how a fund stacks up against its peers. You should always benchmark an IRR against other funds with the same vintage and strategy. That context is everything; it tells you if the manager truly outperformed the market they were operating in.
Don't get mesmerized by a high IRR on its own. Always pair it with cash multiples like TVPI. A quick flip might generate a flashy IRR, but the actual cash profit could be underwhelming.
Can You Have a High IRR but a Low Cash Return?
Yes, and it happens more often than you'd think. This is one of the biggest traps for investors who only look at IRR.
Imagine a manager invests $10 million and gets $12 million back in just six months. That's a 1.2x return, but because it happened so fast, the annualized IRR would look phenomenal. The actual cash-in-pocket for the investor, though? It’s not that impressive.
This is exactly why you must look at IRR and a cash multiple like MOIC or TVPI together. IRR tells you about the speed of the return, while the multiple tells you about the size of the profit. You need both to get the full story.
Turn your fragmented data into actionable portfolio intelligence with Vestberry. Our platform automates IRR calculations, visualizes key metrics, and streamlines LP reporting, freeing you to focus on value creation. Learn how Vestberry can empower your firm.