The simplest way to compute IRR is with a series of cash flows—investments are negative, returns are positive—and a function like =IRR() or =XIRR() in Excel or Google Sheets. But what is it, really? The Internal Rate of Return (IRR) is the specific discount rate that makes the Net Present Value (NPV) of all those cash flows equal zero. It's an indispensable metric for understanding the true annualized return of an investment over its entire life.
Understanding IRR And Why It Matters in Venture Capital
At its core, the Internal Rate of Return (IRR) tells the story of how quickly a fund generates returns. It’s a key performance indicator that separates a good investment from a great one by focusing on the 'when' just as much as the 'what' of financial performance. For any professional in Venture Capital or Private Equity, knowing how to calculate and interpret IRR isn't just a skill—it's essential.
Unlike a simpler metric like Multiple on Invested Capital (MOIC), which only shows you the total value returned, IRR bakes in the crucial element of time. Think of it this way: a 3x return is fantastic, but getting that 3x in five years is a fundamentally different (and better) story than achieving the same multiple over fifteen years. IRR is the metric that quantifies that exact difference.

The Power of Time-Weighted Returns
This intense focus on timing is precisely what makes IRR so vital in the venture world. The entire VC model is built on a cycle of capital calls and distributions that rarely happen on a neat, predictable schedule.
- Capital Calls: These are the initial investments and any follow-on funding rounds. They represent cash outflows from the fund, so in an IRR calculation, they are always negative numbers.
- Distributions & Exits: These are the returns, whether they come from dividends, selling shares, or a final acquisition. They are cash inflows and are always positive numbers.
IRR elegantly stitches these scattered cash flows together to produce a single, annualized rate of return. This gives you a standardized way to measure performance across different investments and funds, no matter how unique their timelines are.
In the high-stakes world of VC, this is how General Partners showcase true performance. A 3x return achieved in 5 years delivers a powerful 24.6% IRR, but if that same multiple takes 15 years, the IRR plummets to just 7.6%. The difference is massive.
A fund's IRR isn't just a number on a page; it's a narrative of efficiency. It tells Limited Partners (LPs) how effectively their capital was put to work and how quickly it generated value, which is fundamental to building trust and securing future commitments.
IRR vs MOIC At a Glance
It’s crucial to understand that IRR and MOIC tell different parts of the same story. Here’s a quick breakdown to clarify when to use each.
Using both metrics together provides a much more complete picture of fund performance than either could alone.
Laying the Groundwork for Calculation
Ultimately, IRR is the discount rate that makes the Net Present Value (NPV) of a project's cash flows exactly zero. While you'll almost never solve this complex equation by hand, understanding the relationship is key. It helps explain why IRR is considered a far more robust measure of profitability than simple return multiples.
This foundation is crucial for confidently communicating fund performance and improving your LP reporting strategy. It sets the stage for mastering the practical calculation methods that drive sharp, data-backed decisions.
The Go-To Methods for Calculating IRR
When it comes to calculating IRR, the textbook theory is one thing, but what you actually do in practice is another. Forget manual formulas and iterative guesswork. For any serious fund professional, the real work happens in a spreadsheet. We'll zero in on the tools you’ll use every day—specifically, Excel’s built-in functions—to get this done right.
The conversation really boils down to two functions: =IRR() and =XIRR(). Knowing which one to use isn't just a technical detail; it's fundamental for anyone in private equity or venture capital. Your choice here directly impacts the accuracy of your performance reporting to LPs.
The Standard IRR Function: A Limited Tool
First, let's talk about the standard =IRR() function. It’s the simpler of the two, built to calculate the internal rate of return for a series of cash flows that happen at regular, evenly spaced intervals. Think monthly or annually, like clockwork.
For instance, if you made an investment on January 1st and got a distribution on January 1st every single year after, =IRR() would work just fine. But let's be honest, that scenario is a fantasy in the world of venture capital. Capital calls happen when a portfolio company needs cash, and distributions arrive when there’s an exit or liquidity event—not on some neat, predictable schedule.
XIRR: The Gold Standard for VC and PE
This is precisely why the =XIRR() function is the indispensable tool for any fund analyst or CFO. The 'X' in its name stands for 'extended', and its superpower is handling cash flows that occur on irregular, specific dates.
To make it work, you need two columns of data:
- The cash flow amounts (investments and distributions).
- The exact date for each of those cash flows.
Because venture capital runs on an unpredictable timeline of capital calls and exits, =XIRR() gives you a far more precise and realistic measure of your fund's performance. It's the accepted standard for LP reporting and internal analysis. When you’re evaluating a new deal, a solid tactical finance due diligence checklist will often require this level of precision to properly vet all financial projections.
Using
=IRR()for irregularly timed cash flows is a rookie mistake that can seriously distort your performance numbers. For any venture or private equity analysis, you should always default to=XIRR()to ensure your calculations are accurate and defensible.
Getting Your Data Structured for Success
The accuracy of your IRR calculation is only as good as the data you feed it. A small formatting error can throw everything off. The core principle is simple: money out is negative, and money in is positive.
- Capital Calls (Investments): Any cash you deploy into a portfolio company is a negative number. This starts with the initial investment and includes every follow-on round.
- Distributions (Returns): Any cash that comes back to the fund is a positive number. This could be from dividends, a secondary sale, or the proceeds from a final exit.
This simple positive/negative structure is the foundation of every reliable IRR calculation. It’s a crucial metric because it’s how the illiquid world of VC and PE benchmarks itself against public markets. While the S&P 500 has averaged around 10% annually over the long term, top-quartile VC funds are targeting returns of 20-30% or more to compensate for the added risk and lack of liquidity. The =XIRR() function essentially finds the discount rate that makes the net present value of all those dated cash flows equal zero.
This screenshot from Microsoft’s documentation shows the basic syntax you’ll use.
As you can see, the function just needs a range for the cash flow values (B2:B6) and a matching range for the dates (A2:A6). The result is a clean, annualized rate of return.
Mastering this data setup builds the practical muscle memory you need to move beyond theory and into what actually works in a fast-paced fund. It's about building reliable systems, and for those looking to move past common spreadsheet errors, our guide to smarter reporting than Excel can help ensure your calculations are not just correct, but rock-solid.
Computing IRR with Real-World VC Scenarios
Alright, let's get practical. Theory is one thing, but your day-to-day work is full of messy, complex scenarios where a single misplaced number can throw everything off. This is where we’ll put the IRR calculation to the test, moving from clean, textbook examples to the kind of multi-stage investments that really define venture capital.
We'll start with a simple case and gradually layer in more complexity. You'll see just how powerful the XIRR function in Excel or Google Sheets is for handling these real-world situations.
The basic process is straightforward: line up your dated cash flows, apply the function, and get your performance metric.
The real trick is structuring your data correctly. Get that right, and the calculation itself becomes a reliable, repeatable step instead of a source of late-night headaches.
The Clean Exit: A Single Investment and Return
Let's begin with a "best-case" scenario. Imagine your fund invests $2 million into a seed-stage startup on January 15, 2021. Fast forward a few years, and the company is acquired. A tidy $10 million distribution lands in your fund's bank account on June 30, 2024.
Here's what your data table would look like:
To find the IRR, you’d turn to the XIRR function. If your dates are in cells A2 and A3 and the cash flows are in B2 and B3, the formula is simply:
=XIRR(B2:B3, A2:A3)
The result? A stellar 54.9% IRR. This clean example is a great baseline for understanding the direct relationship between a capital call, a distribution, and the resulting annualized return.
Adding Complexity: Multiple Capital Calls and a Partial Exit
Now for a scenario that feels a lot more familiar. Investments are rarely a one-and-done deal. Funds typically make follow-on investments to help a portfolio company scale.
Let's build on our previous example. The initial $2 million investment is the same. But a year later, you participate in the Series A round with another $3 million capital call. Two years after that, instead of a full acquisition, you execute a secondary sale of a small portion of your shares, bringing in a $4 million distribution. Finally, the company has its big exit a year later, returning the remaining $15 million.
Here’s how you'd structure the data for this journey:
Plugging this into the XIRR formula, =XIRR(C2:C5, A2:A5), gives you an IRR of 40.1%. Notice how the follow-on investment and the timing of the distributions significantly changed the final number. This is the magic of XIRR—it precisely weights every cash flow based on its specific date.
A key takeaway from the trenches: In venture capital, your IRR is a living metric. It moves with every capital call and every distribution. The ability to track these changes accurately is what separates well-managed funds from those constantly scrambling to explain their numbers.
For fund managers looking to automate these calculations, specialized software can be a game-changer. For instance, you can see how Connect Ventures adopted a new fund management strategy with Vestberry to streamline their operations.
Calculating Interim IRR for LP Reporting
One of the most critical jobs for any fund manager or CFO is preparing those quarterly LP reports. Since most of your investments are unrealized, you can't just use realized cash flows. You need to calculate an interim IRR, which means incorporating the current Fair Market Value (FMV) of the investment.
The standard way to do this is to treat the latest FMV as if it were a final, positive cash flow that occurred on the reporting date.
Let's go back to our multi-stage example, but this time, the final exit hasn't happened. As of your Q3 reporting date, September 30, 2024, the remaining stake in the company is valued at $12 million.
Your cash flow table for the LP report would be set up like this:
The XIRR calculation, =XIRR(C2:C5, A2:A5), now yields an interim IRR of 44.8%. This is the figure you'd present to your LPs, as it gives them a clear snapshot of the investment's performance to date, blending both realized cash and unrealized value.
This method is standard practice and aligns with industry reporting guidelines. The key is to always use the valuation date as the date for the FMV cash flow. While we're focused on venture capital, IRR is a cornerstone metric across finance. Its power is evident when analyzing the complex waterfalls of Commercial Mortgage-Backed Securities (CMBS) deals, demonstrating its wide-ranging utility. Mastering these real-world calculations ensures your reporting is accurate, defensible, and provides genuine insight into your fund's performance.
Getting to Grips With IRR’s Quirks: Multiple IRRs and MIRR
The Internal Rate of Return is an absolute staple in the world of venture capital and private equity. It's the go-to metric for performance. But it’s not perfect, and if you're not careful, it can sometimes lead you down the wrong path.
Knowing how to handle its peculiarities is what separates the pros from the novices, especially when you're dealing with less-than-perfect cash flow streams.
One of the most head-scratching issues you can run into is the problem of multiple IRRs. This happens with "unconventional" cash flows—think of a project where the money flows out, then in, then out again. A classic example is an investment that requires a hefty decommissioning cost at the very end, flipping that final cash flow negative.
Mathematically, every time the cash flow sign flips from positive to negative or vice versa, it creates another possible solution for the IRR equation. You’re left with two or more equally "correct" IRRs, making it impossible to pin down the actual return. It’s a red flag that the standard IRR just isn't the right tool for this particular job.
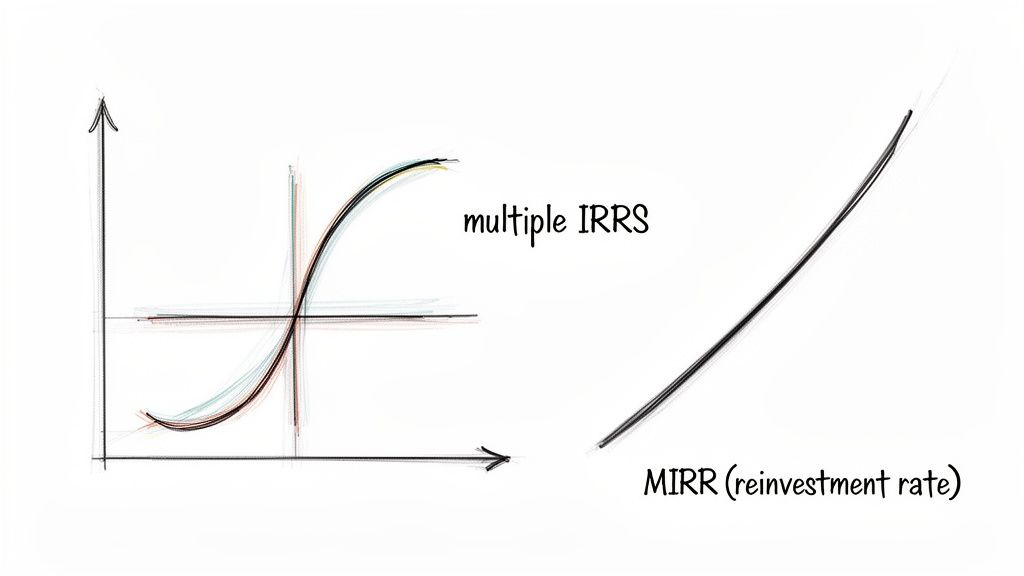
A Better Way: The Modified Internal Rate of Return (MIRR)
When IRR gets confusing, the Modified Internal Rate of Return (MIRR) is your solution. It’s a smarter metric built to solve one of IRR's biggest theoretical weaknesses: the reinvestment rate assumption.
Here’s the thing: standard IRR works by assuming that every dollar of positive cash flow you receive is immediately reinvested at a rate equal to the IRR itself. If a deal has a 40% IRR, the formula assumes you can take every distribution and put it to work in another opportunity that also yields 40%. In the real world, that's almost never the case.
MIRR fixes this by letting you define two separate, more realistic rates:
- The Finance Rate: This is what it costs you to borrow money to cover the negative cash flows. Think of it as your cost of capital.
- The Reinvestment Rate: This is the rate you can realistically expect to earn on the positive cash flows. This could be a conservative estimate, like your fund's target return or even a risk-free rate.
By splitting these out, MIRR gives you a far more grounded and defensible view of an investment's true performance.
Putting MIRR to Work
Thankfully, you don't need to break out the old financial calculator to figure this out. Both Excel and Google Sheets have a built-in MIRR function.
The syntax is straightforward: =MIRR(values, finance_rate, reinvest_rate)
Let's use a quick example. Say you have a project with these cash flows:
- Year 0: -$10,000 (Initial Investment)
- Year 1: $5,000
- Year 2: $6,000
- Year 3: $4,000
Let's also assume your cost of capital (finance rate) is 8%, and you can safely reinvest any cash distributions at 12%. In your spreadsheet, the formula would look like this: =MIRR(A2:A5, 0.08, 0.12).
This gives you a MIRR of 19.8%, a much more sober and realistic figure than what the standard IRR might have shown.
Key Takeaway: MIRR is your go-to for a more conservative and often more accurate look at profitability. It's especially useful for projects with complex cash flows or when you need to present a rock-solid performance case to your LPs. It cuts through the ambiguity of multiple IRRs and grounds your analysis in reality.
IRR vs MIRR Which Metric to Use
So, when should you use IRR versus MIRR? It really comes down to choosing the right tool for the job—the one that best reflects the financial truth of the investment. This table breaks down the key differences to help you decide.
At the end of the day, knowing how to calculate IRR is a fundamental skill. But knowing its limits—and when to switch to a more robust metric like MIRR—is what truly marks a seasoned financial analyst.
Common Pitfalls in IRR Reporting to LPs
When you’re reporting your fund’s performance back to your Limited Partners (LPs), the Internal Rate of Return isn't just another number. It's a direct reflection of your credibility. A single miscalculation or a poorly explained IRR can instantly sow doubt and lead to some pretty uncomfortable questions. For the sake of your LP relationships, you have to get this right.
The pressure to showcase strong returns is real, and it can sometimes lead to honest mistakes. But even small errors can have major consequences, quickly turning what should be a standard quarterly update into a very difficult conversation. The best defense is a good offense—knowing the most common traps is the first step to building a reporting process that’s airtight.
Confusing Gross vs. Net IRR
This is probably the most common—and most damaging—mistake I see. Failing to clearly separate Gross IRR from Net IRR is a huge red flag for LPs. While both metrics have their place, they tell two completely different parts of the story, and your investors expect you to be upfront about which is which.
- Gross IRR: Think of this as your "raw" investment performance. It measures how well the underlying portfolio companies are doing before you factor in any management fees, fund expenses, or carried interest. It's the purest measure of your team's ability to pick winners and help them grow.
- Net IRR: This is the number your LPs truly care about. It’s their bottom-line, take-home return after every last fee and point of carry has been taken out. This is what defines their financial outcome from investing in your fund.
Sliding a Gross IRR into a report without a clear label is a rookie move that can look intentionally misleading. Best practice? Always show both, side-by-side, with crystal clear labels. It’s a simple act of transparency that shows you respect your LPs and helps them accurately gauge both your investment skill and your fund's efficiency.
Mishandling Cash Flow Timing and Data
An IRR calculation is completely at the mercy of its inputs. The timing and amount of your cash flows are everything. Even a small error—getting a date wrong or miskeying a distribution amount—can throw off your IRR, sometimes significantly. This is especially true when you're using a function like XIRR, which is acutely sensitive to the exact dates of each transaction.
The most frequent culprit here is simply mis-timing cash flows. Recording a capital call on the 15th of the month when it actually cleared on the 1st can change the annualized return. This is precisely why a single source of truth for your transaction data isn't just a nice-to-have; it's an absolute necessity. Trying to reconcile multiple spreadsheets or relying on manual data entry is just asking for trouble.
Your IRR is only as reliable as the data it's built on. Every fund should have a rigorous, centralized process for recording and verifying the date and amount of every single capital call and distribution. Without this discipline, your reporting foundation is unstable.
Incomplete Reporting Without Context
Just dropping a single IRR figure into a report and calling it a day is not nearly enough. LPs are sophisticated; they need context to understand what that number actually represents. For instance, a sky-high IRR might look amazing, but it could be driven by one small, early exit while the vast majority of the portfolio is still sitting unrealized.
To give your LPs the full picture, your IRR should always travel with a few other key performance indicators. The Institutional Limited Partners Association (ILPA) has set clear guidelines on this, and following them is the gold standard. A truly comprehensive report should always include:
- Total Value to Paid-In (TVPI): This multiple shows the fund's total value (both realized and unrealized) compared to the capital LPs have contributed.
- Distributions to Paid-In (DPI): This is the "cash-on-cash" return. It tells LPs how much money has actually been returned to their bank accounts. A fund with a high IRR but a low DPI still has most of its performance locked up on paper.
- Realized vs. Unrealized Value: Always break down how much of the fund's value comes from cold, hard cash versus current fair market valuations of the remaining assets.
Presenting these metrics together provides a balanced, 360-degree view of performance. It helps your LPs understand not just the current IRR, but also how far along the fund is on its journey to returning their capital. It’s the difference between just reporting a number and telling the complete, transparent story of your fund.
By sidestepping these common pitfalls, you’re doing more than just calculating IRR correctly. You’re building the one thing that matters most: the lasting trust that forms the bedrock of every successful GP-LP relationship.
Diving Deeper: Common IRR Questions Answered
Even after you've got the mechanics down, real-world questions always pop up. The world of venture capital is full of unique situations, and knowing the nuances behind the IRR is key to communicating clearly with your LPs and other stakeholders.
Let's tackle some of the most common questions we hear from fund managers and analysts about putting IRR to work. We'll get into what a "good" IRR actually looks like, how to handle the raw data of capital calls and distributions, and why XIRR is your best friend.
What Is a Good IRR for a Venture Capital Fund?
There isn't a single magic number, but historically, top-quartile VC funds have aimed for a net IRR of 20% to 30% or more. Of course, this benchmark can swing wildly depending on the fund's focus (Seed is a different game than Growth), its vintage year, and the general market weather.
A "good" IRR is really one that substantially outperforms public market equivalents, like the S&P 500, to make up for the high risk and lack of liquidity that comes with the territory.
The only way to get a true read on performance is to benchmark against the right vintage year data from sources like Cambridge Associates or PitchBook. A stellar IRR in a bull market might just be average in a different cycle—context is everything.
How Do I Handle Capital Calls and Distributions in an IRR Calculation?
Getting the signs and dates right on your cash flows is the most critical part of the whole exercise. The rule of thumb for any IRR calculation is simple: money out is negative, money in is positive.
- Capital Calls: This is cash flowing out of the fund to make an investment. Always treat these as negative numbers (e.g., -$1,000,000).
- Distributions: This is cash or stock coming back to your investors. These are always positive numbers (e.g., +$5,000,000).
For any interim reporting, the investment's current Fair Market Value (FMV) is handled as if it were a final, positive cash flow that occurred on the valuation date.
Can IRR Be Negative, and What Does It Mean?
Absolutely. A negative IRR simply means the investment has lost money—the total cash you got back is less than the total capital you put in.
If a fund calls $5 million over its life and only distributes $4 million back to LPs, the IRR will be negative. The exact percentage tells you the annualized rate of loss over that investment period. It's an unambiguous signal that the investment didn't clear the bar.
Why Is XIRR Better Than IRR for Fund Performance Measurement?
For pretty much any VC or PE analysis, the XIRR function is vastly better than the standard IRR function. Why? Because it accounts for the specific, irregular dates of each cash flow.
The basic IRR function works on the assumption that every transaction happens at a nice, even interval, like at the end of each year. But that's just not how venture capital works. Capital is called and distributed on unpredictable dates.
By forcing you to pair a specific date with each cash flow, XIRR gives you a much more precise and defensible calculation of the annualized return. That level of accuracy isn't just nice to have; it's essential for building transparent and compliant LP reports.
Ready to move beyond spreadsheets and automate your IRR calculations with a single source of truth? At Vestberry, we help VC and PE firms turn fragmented data into actionable portfolio intelligence. Learn how Vestberry can streamline your fund's reporting and analytics.