
In a world of paper gains and ever-changing valuations, there's one metric that tells the real story of a venture fund's success: Distributions to Paid-in Capital (DPI). For investors, DPI cuts through the noise. It represents the actual, tangible cash returned on their investment, making it the ultimate measure of a fund manager's ability to turn portfolio growth into money in the bank.
Why DPI Is the Ultimate Venture Capital Metric
Not all metrics are created equal, especially in venture capital. While some numbers paint a promising picture of what could be, DPI venture capital measures the concrete reality of what is.
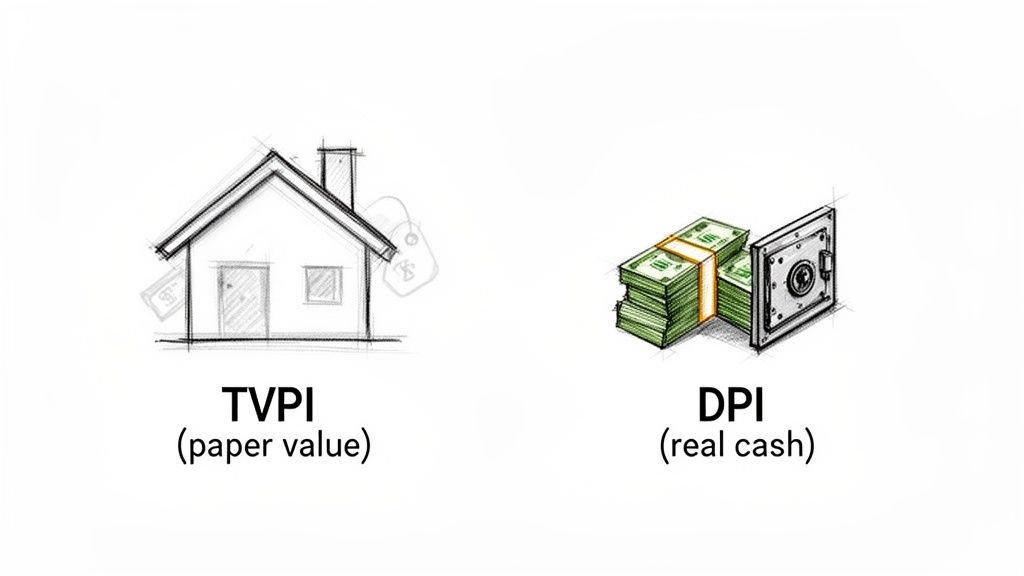
Think of it like this: Total Value to Paid-in Capital (TVPI) is like the Zillow estimate for your house—an exciting number, but it’s just on paper. DPI is the cash that actually hits your bank account after you’ve sold the house and paid the fees. It's real.
This distinction is especially crucial in today's tough exit markets, where converting those paper gains into actual liquidity is the single biggest challenge. A high DPI is proof that a General Partner (GP) knows how to navigate the market and return capital to their Limited Partners (LPs). For that reason, a strong DPI is arguably the most powerful tool a GP can have in their fundraising arsenal.
The Shift from Promise to Proof
The venture landscape is filled with funds that boast impressive on-paper returns but have yet to deliver a dollar back to their investors. This is precisely why savvy LPs now scrutinize DPI more than any other metric.
Recent benchmarks paint a stark picture: a staggering more than 60% of VC funds from the 2019 vintage hadn't returned any capital to LPs after five years. This highlights a massive slowdown in liquidity and a major shift in how performance is judged.
To help you grasp the essentials quickly, here’s a breakdown of DPI's core concepts.
DPI Core Concepts at a Glance
This table underscores why the focus has moved from promise to proof. A healthy DPI isn't just a number; it’s a track record.
This new reality boils down to a few key points:
- It Measures Realized Success: DPI is the only metric that separates actual cash distributions from speculative, unrealized value.
- It Demonstrates Manager Skill: A solid DPI proves a manager can successfully guide companies toward profitable exits, not just mark up their valuations.
- It Aligns GP and LP Interests: Ultimately, cash returns are the shared goal, making DPI a critical, unifying metric for everyone involved.
To better understand the unique dynamics of this asset class, exploring guides on investing in private equity can provide essential context for why DPI has become so important. For today’s fund managers, mastering DPI isn't just an option—it’s a matter of survival.
For a deeper dive into building a robust reporting framework, check out our guide on a smart KPI setup for VC portfolio monitoring.
How to Calculate DPI: A Practical Walkthrough
Let's get practical and break down the Distributions to Paid-in Capital (DPI) calculation. You don't need a finance degree to master it. The formula is refreshingly simple, designed to give you a clear, no-nonsense look at the actual cash a fund has returned to its investors.
At its heart, the math looks like this:
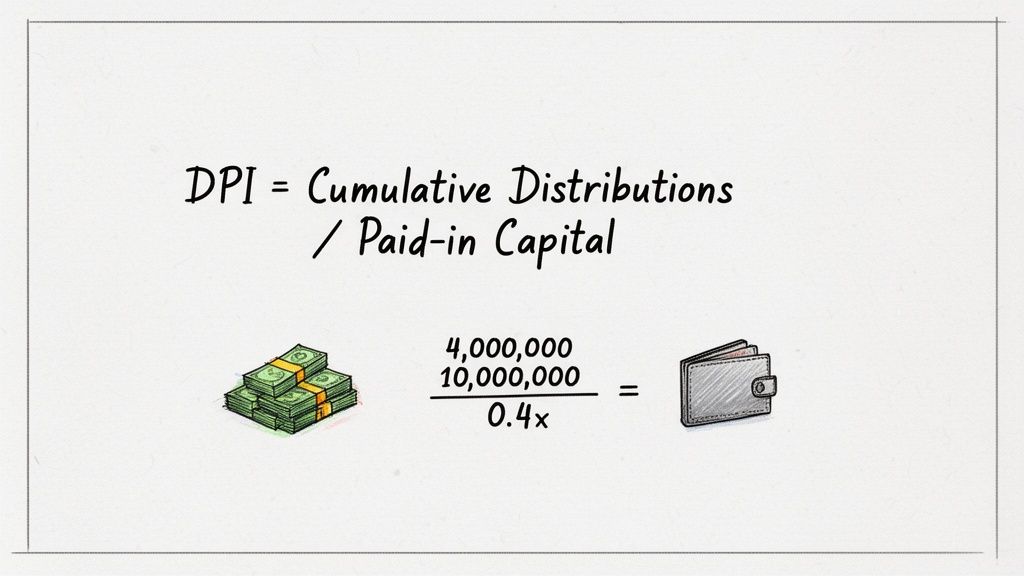
DPI = Cumulative Distributions / Paid-in Capital
But what does that really mean when you're staring at a fund report? To get the full picture, we need to look at what goes into each side of that equation. This simple ratio is the bedrock for understanding a fund's realized performance—the cash that’s actually back in your pocket.
Unpacking the Formula Components
First up is the numerator: Cumulative Distributions. Think of this as the total cash (or stock) that has physically made its way back to the Limited Partners (LPs). It's the sum of all proceeds from successful exits—like a portfolio company getting acquired or going public—plus any dividends paid out along the way. It’s the tangible, spendable return.
Next, we have the denominator: Paid-in Capital. This is the total amount of money LPs have actually wired to the fund so far. It's crucial not to confuse this with "committed capital," which is the total amount an LP promises to invest over the fund's entire life. Paid-in capital only counts the funds that the General Partner (GP) has officially "called" and received.
By dividing what’s been handed back by what’s been put in, you get a straightforward multiple that answers a critical question: for every dollar I've given the fund, how much have I gotten back?
A Step-by-Step Calculation Example
Let's put this into action with a real-world scenario.
Imagine a new venture fund called "Innovate Growth Fund I." It has successfully raised $20 million in total commitments from its LPs.
Capital Calls are Made: Over the first couple of years, the GP calls capital to fund investments in a handful of exciting startups. The total amount collected from LPs adds up to $10 million. This is the fund's Paid-in Capital.
Successful Exits Occur: The fund gets lucky with two early wins. One of its portfolio companies is acquired by a larger tech firm, and another facilitates a secondary sale. Both events generate cash.
Distributions are Sent to LPs: Following these exits, the fund wires a total of $4 million back to its investors. This becomes the Cumulative Distribution.
Now, let's plug these numbers into the formula:
- DPI = $4,000,000 (Cumulative Distributions) / $10,000,000 (Paid-in Capital)
- DPI = 0.4x
This 0.4x DPI tells a simple but powerful story. It means that for every dollar an LP has invested in the fund to date, they've received 40 cents back in cash.
Interpreting Your DPI with Industry Benchmarks
So you've calculated your DPI. What does that number actually tell you? On its own, not much. The real story emerges when you place it in the context of your fund's age and compare it against industry benchmarks. This is how a simple multiple becomes a powerful signal of your fund's health and performance.
The first and most important milestone is a DPI of 1.0x. Hitting this magic number means you’ve returned every single dollar of paid-in capital back to your Limited Partners. Think of it as the cash-on-cash breakeven point—from here on out, every distribution is pure profit.
If your DPI is below 1.0x, don't panic. This is completely normal, especially in a fund's early years when investments are still maturing. It just means your LPs are still in the process of getting their initial capital back. The goal, of course, is to push past 1.0x, which proves the fund is generating real, tangible profits.
What Makes a Good DPI
Defining a "good" DPI is all about timing. A fund's age, or its vintage year, is everything. A five-year-old fund sporting a 0.3x DPI could be right on track, showing early signs of liquidity. But if a ten-year-old fund has that same DPI, it's a major red flag.
Here’s a general guide to what LPs expect as a fund matures:
- Early-Stage Funds (Years 1-4): The DPI will likely be at or near zero. At this stage, the focus is all on deploying capital, not harvesting returns.
- Mid-Stage Funds (Years 5-7): Any positive DPI is a great sign. Seeing cash start to flow back shows the manager can successfully orchestrate exits.
- Mature Funds (Years 8+): By now, LPs want to see a DPI well over 1.0x. Top-quartile funds often aim to land in the 2.0x to 3.0x range or even higher, signaling truly exceptional performance.
A strong DPI is the ultimate proof of a manager's ability to deliver real returns. In a market where paper gains can evaporate, cash distributions are the most reliable measure of success.
Current Market Benchmarks and LP Expectations
The current economic climate has put DPI under a microscope, making it the most scrutinized metric in DPI venture capital. With a slowdown in exits, LPs are laser-focused on actual cash hitting their bank accounts, not just impressive-looking paper valuations.
Recent industry analysis confirms this shift. While private equity distributions have ticked up slightly, VC-specific DPI has remained stubbornly low. A recent McKinsey LP survey revealed that 2.5 times more institutions now consider DPI their most critical metric compared to just three years ago. This trend has only been amplified by a tough fundraising environment, which has dropped 28% to its lowest level since 2012. You can dig deeper into these private markets trends on mckinsey.com.
This intense focus means GPs have to be ready to discuss their DPI performance with data-backed confidence. Knowing how your fund measures up against its vintage-year peers isn’t just a nice-to-have anymore. It's an absolute necessity for managing LP expectations and building a strong case for your next fund.
DPI vs. TVPI, RVPI, and IRR: Untangling the Metrics
The world of venture capital performance can feel like an alphabet soup of acronyms. But while DPI is the ultimate truth-teller, understanding how it relates to TVPI, RVPI, and IRR is essential for painting a complete picture of a fund's health.
Each metric tells a different part of the story, and knowing which one to lean on is crucial for clear, honest communication with your Limited Partners (LPs).
TVPI and RVPI: The "Promise" vs. The "Potential"
Think of it this way: TVPI (Total Value to Paid-in Capital) is the promise of a fund. It’s the total headline value, combining both the hard cash you've already returned (DPI) with the on-paper, unrealized value of the companies still in the portfolio. It's the big-picture view of what the fund could be worth.
In contrast, DPI (Distributions to Paid-in Capital) is the proof. It measures only the cold, hard cash that has been wired back to LPs. It completely ignores paper gains, focusing solely on realized returns. This makes DPI the most conservative and scrutinized metric, especially as a fund gets older.
The glue that holds these two together is RVPI (Residual Value to Paid-in Capital). This represents the current market value of the fund's unsold investments—the remaining potential.
The relationship is elegantly simple:
TVPI = DPI + RVPI
This formula gives you a clear framework. A young fund might have a fantastic TVPI but a very low DPI, which is perfectly normal. It just means most of the value is still locked up in promising but un-exited companies. As the fund matures and exits happen, you'll see value methodically shift from the RVPI column over to the DPI column, turning those paper gains into cash in hand.
Where IRR Fits Into the Puzzle
So, what about the IRR (Internal Rate of Return)? If the other metrics tell you how much money you made, IRR tells you how fast you made it.
While DPI, TVPI, and RVPI are all about the multiple of capital returned or created, IRR measures the speed and timing of those returns. It calculates the annualized rate of return, taking into account exactly when capital was called and when distributions were sent out.
For example, a fund could post a mediocre final DPI but still have a stellar IRR if it managed to return capital quickly in its early years. On the flip side, a fund could achieve an outstanding DPI of 3.0x but have a less impressive IRR if it took over a decade to do it.
The flowchart below breaks down how to interpret the most critical DPI milestones.
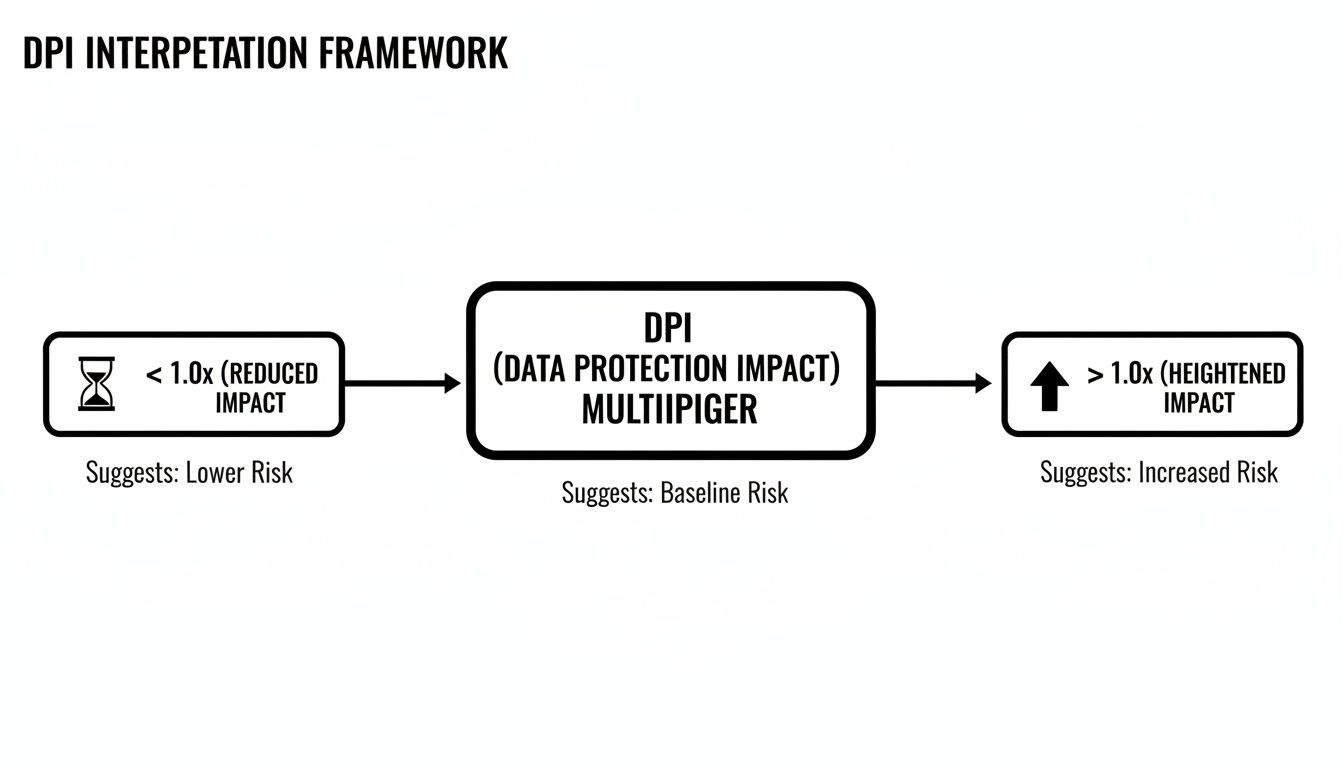
As you can see, hitting a DPI of 1.0x is the pivotal break-even point—the moment investors have officially gotten all their money back.
To help clarify these distinctions, let's look at them side-by-side.
Key VC Performance Metrics Compared
This table provides a quick reference for understanding the unique role each of these core metrics plays in assessing fund performance.
Each of these KPIs serves a critical purpose at different stages of a fund's life. Mastering how they interact empowers you to tell a more nuanced and accurate performance story, helping you build trust and confidence with your LPs.
Mastering DPI Reporting to Build Stronger LP Relationships
Transparent, consistent reporting is the currency of trust between General Partners (GPs) and their Limited Partners (LPs). When it comes to DPI venture capital performance, this isn't just about fulfilling an obligation. It's about turning your reporting into a powerful tool for building and strengthening those crucial relationships.
Effective reporting starts with a deep understanding of the broader capital landscape. It can be helpful to first explore new business funding options to see where venture capital sits. This wider context really underscores why clear, reliable metrics are so vital in such a competitive market for capital.
At its core, a solid reporting framework is all about consistency. You need to establish a clear calculation methodology and stick with it. This ensures your LPs can track performance quarter over quarter without any confusion or second-guessing.
Key Pillars of Transparent DPI Reporting
The real goal here is to eliminate surprises. You want to proactively answer the questions you know your LPs will have. This means doing more than just sending over a number; it's about weaving a narrative around your data that showcases your strategic thinking and a clear vision for the fund.
A few best practices can make all the difference:
- Stick to a Regular Schedule: Quarterly reporting is the industry standard for a reason. This steady rhythm keeps LPs in the loop and signals a high level of professionalism and accountability.
- Clarify Distribution Types: Always be explicit about whether distributions are cash or in-specie (stock). This transparency is absolutely critical for LPs who are managing their own liquidity and tax obligations.
- Follow Industry Standards: Aligning your reports with guidelines from organizations like the Institutional Limited Partners Association (ILPA) adds instant credibility. It also makes life much easier for institutional investors who are reviewing dozens of reports.
Transparent reporting isn’t just about sharing good news. It’s about building a foundation of trust that can withstand market cycles and periods of slower performance.
Framing Performance and Managing Expectations
How you present your DPI is just as important as the number itself. If your DPI is still low—which is completely normal in a fund's early years—don't just report the number in a vacuum. Frame it with context. Compare your fund's progress against relevant vintage year benchmarks to show that you're on the right track.
On the flip side, if performance is strong, highlight the specific exits that drove those returns. Tell the story behind the success.
By providing this narrative, you help LPs see the bigger picture behind the data. For a deeper dive, you can learn more about how to elevate your communication by understanding the LP's perspective on data-driven VCs. Ultimately, thoughtful DPI reporting is proof that you're a responsible steward of their capital, which strengthens relationships and paves the way for a smoother fundraising process next time around.
How Portfolio Intelligence Platforms Drive DPI Insights
Let's be honest: tracking DPI in venture capital across a tangled web of spreadsheets is a nightmare. It’s slow, full of potential human errors, and simply doesn't scale as your fund grows. This is where modern portfolio intelligence platforms come in, replacing the manual grind with a single source of truth for all your fund and portfolio company data.
These systems are built to pull in scattered information and organize it into one coherent, real-time database. By doing so, they automatically calculate crucial metrics like DPI, TVPI, and IRR. This frees up your team from the tedious, high-stakes game of manual data entry and formula management. It's not just about saving time; it's a genuine strategic advantage.
From Data Wrangling to Strategic Decisions
The real magic of a portfolio intelligence platform is how it shifts your team’s focus from wrestling with data to actually analyzing it. Instead of spending hours updating rows and columns, you can generate fully compliant LP reports with just a few clicks. Or, you can pull up interactive dashboards to see exactly which investments are driving returns at a glance.
This dashboard from a leading portfolio intelligence platform, for example, gives you an instant visual breakdown of DPI and other key metrics for quick, clear analysis.
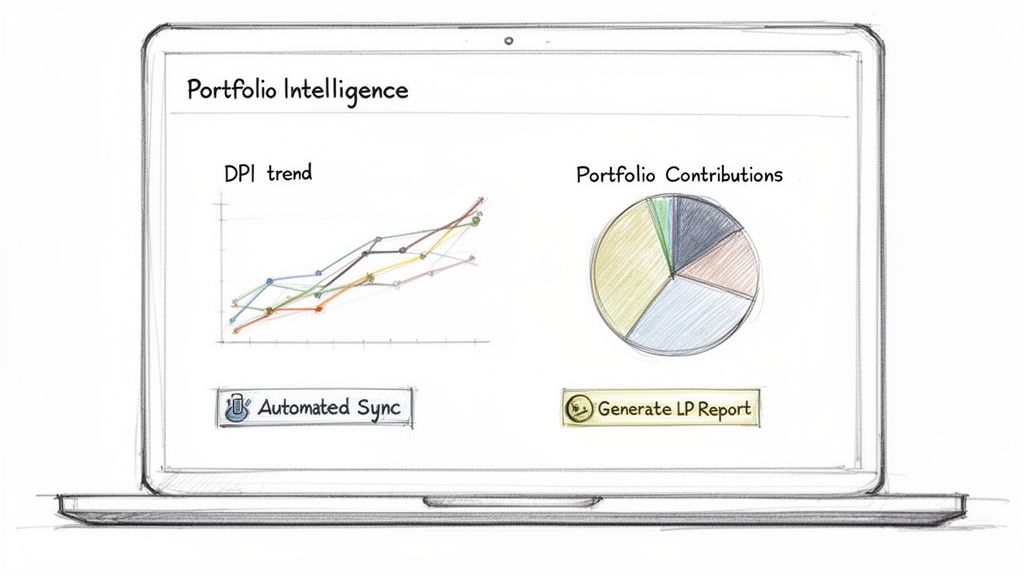
This kind of immediate visibility helps managers pinpoint what’s working, understand performance trends over time, and make smarter, data-backed decisions that ultimately boost fund performance and build investor trust.
Navigating Market Volatility with Real-Time Data
In a market that can turn on a dime, real-time data is everything. We recently saw global VC funding jump back to $115 billion in Q2, a nice rebound from previous quarters. But that number hides the deeper liquidity issues that show up as stubbornly low DPI across most vintages.
For investment teams, this is where granular dashboards that track multiples and DPI in real-time—and according to ILPA standards—become indispensable. They help you validate your strategy when the market gets choppy and make it easy to produce LP reports that showcase your fund's edge in a DPI-starved environment.
By centralizing all portfolio data, these platforms empower VCs to:
- Automate Reporting: Instantly generate accurate, ILPA-compliant LP reports.
- Enhance Data Integrity: Say goodbye to errors from manual spreadsheet management.
- Surface Actionable Insights: Use dynamic dashboards to analyze what's driving performance.
- Strengthen LP Confidence: Deliver transparent, timely, and professional reporting.
If your firm is just getting started, adopting a system like this early on is a game-changer. You can learn more about the benefits of using a portfolio intelligence solution since your first fund and set your team up with best practices from day one.
Got Questions About DPI? We've Got Answers.
Even once you get the hang of the formula, putting DPI into practice in the venture capital world brings up some common questions. Let's tackle a few of the ones we hear most often from both GPs and LPs.
What Is a Good DPI for a Venture Capital Fund?
Honestly, "good" is a moving target. It really depends on the fund's age—its vintage—and strategy. If you're looking at a young fund, say three to five years old, seeing any positive DPI at all is a great early sign. It shows they're already getting cash back to investors.
Now, for a mature fund that's been around for seven to ten years or more, the goalposts move. LPs expect to see a DPI well past the 1.0x breakeven point. The top-performing funds? They're often targeting a final DPI of 2.0x to 3.0x or even higher, which signals a fantastic cash-on-cash return. The key is to always benchmark a fund against others from the same vintage; market cycles have a massive impact on when companies can exit.
How Do Capital Calls Affect the DPI Calculation?
Every time a GP makes a capital call, it directly increases the "Paid-in Capital"—the bottom number in the DPI equation. In the early days of a fund, the manager is constantly calling capital to fund new deals, so that denominator just keeps growing.
The takeaway? Since the numerator (Cumulative Distributions) is usually zero for the first few years, a growing denominator means the DPI will naturally sit at or near zero. This is exactly why DPI is considered a lagging indicator; it only becomes truly meaningful once a fund matures and starts cashing in on its investments.
Can DPI Ever Be Negative?
Nope, a negative DPI is impossible. The logic is simple: both parts of the formula, distributions and paid-in capital, can only be zero or positive. You can't distribute less than zero cash, and you can't invest a negative amount.
The absolute lowest a fund's DPI can be is 0.0x. This is the starting point before any money has been returned. While a fund can definitely post a negative IRR if it loses money overall, its DPI will always stay at zero or above, reflecting the simple reality of cash in, cash out.
Turn fragmented data into your most powerful strategic asset. Vestberry is the portfolio intelligence platform that provides a single source of truth for VCs, automating DPI calculations and surfacing the insights you need to drive performance and strengthen LP confidence. Learn how Vestberry can empower your fund.