In the worlds of private equity and venture capital, the hurdle rate is a simple but powerful concept. It's the minimum rate of return a fund has to earn before the fund managers, or General Partners (GPs), can start taking their share of the profits—a performance bonus known as carried interest.
Think of it like a high-jump bar set by the investors. The GPs only get their prize money after they've successfully cleared that bar.
What Is a Hurdle Rate in Fund Economics?
At its core, a hurdle rate is a safety net for investors, who are called Limited Partners (LPs). It guarantees that the GPs are laser-focused on delivering a solid baseline return to their LPs before they can start pocketing any of the upside themselves. This setup is brilliant because it aligns everyone's interests, making sure the first priority is returning the LPs' original capital plus a respectable profit.
This rate is a crucial piece of the fund's “waterfall” structure—the sequence that dictates how money flows back to everyone involved. Cash distributions first go to the LPs to pay back their initial investment and then to satisfy the hurdle rate. Only after those two conditions are met can the GPs begin to receive their carried interest.
Why Is 8% the Magic Number?
If you spend any time around private equity, you’ll hear one number over and over: 8%. That’s the most common hurdle rate, and it wasn't picked out of a hat. It became the industry benchmark because it was seen as a fair premium over safer, more liquid investments. After all, LPs are tying up their capital for years in illiquid funds, so they expect a better return for that risk.
This structure really took hold during the LBO boom of the 1980s and has stuck around ever since. Recent industry data shows that 78% of PE funds now include an 8% hurdle, a notable jump from 65% in 2015. This shift highlights how LPs are negotiating for stronger protections in a more complex economic environment. You can dive deeper into these PE fund structures to see how they've evolved.
The relationship between the fund, the hurdle, and the final payout is a simple hierarchy.
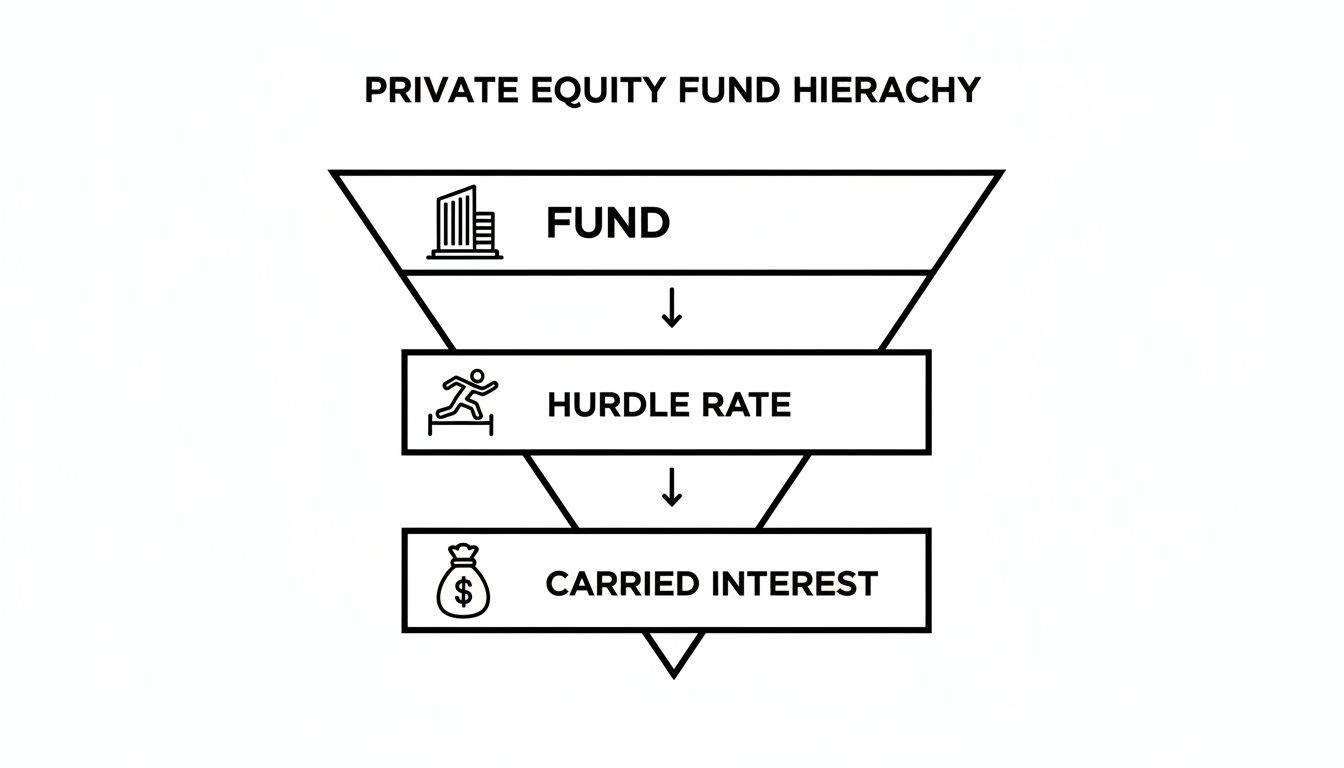
As you can see, the hurdle rate acts as the gatekeeper. Profits have to clear this level before they can flow down to the GPs as carried interest.
To make these concepts even clearer, here’s a quick breakdown of the key terms and what they mean in the real world.
Key Hurdle Rate Concepts at a Glance
This table shows how all the pieces fit together to create a system that balances risk and reward for both investors and fund managers.
Key Takeaway: The hurdle rate isn't just a number; it’s a core governance tool. It enforces discipline on fund managers and gives LPs the confidence that their capital is being deployed effectively toward a clear, pre-agreed performance target. Without it, GPs could get paid handsomely for delivering mediocre results.
How to Calculate Your Fund's Hurdle Rate
So, how do you actually land on a specific hurdle rate for your fund? It’s not about pulling a number out of thin air. Think of it as a strategic blend of rock-solid financial benchmarks and a thoughtful assessment of the risks you're asking investors to take.
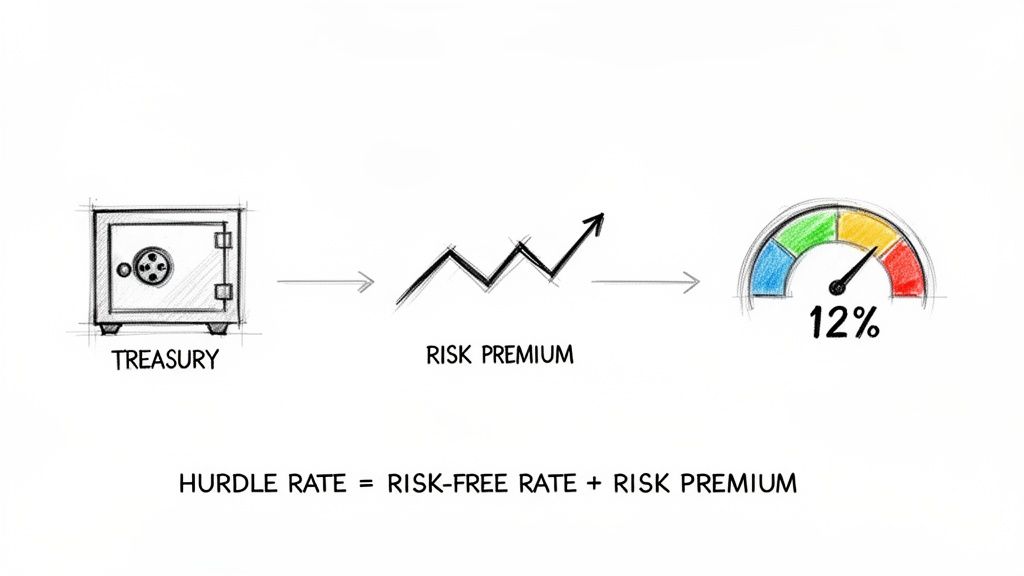
It all starts with a simple but powerful formula.
Hurdle Rate = Cost of Capital + Risk Premium
Let's break that down. The cost of capital is your baseline—the absolute minimum return an investor could get somewhere else with almost zero effort or risk. It’s the opportunity cost of putting money into your long-term, illiquid fund instead of, say, a government bond.
The risk premium is where the art and science of fund management really come into play. This is the extra slice of return investors need to see to make peace with the unique uncertainties that come with private market investing.
Nailing Down the Cost of Capital
Your cost of capital is almost always anchored to a risk-free rate. This is simply the return you could expect from an investment that has virtually no chance of going belly-up.
- The Gold Standard: U.S. Treasury bills (T-bills) are the go-to benchmark for the risk-free rate. Their yield effectively sets the floor for any investment conversation.
For instance, if a 10-year Treasury bill is yielding 4%, no sane investor would lock up their money in a private equity fund for a decade without the promise of a much higher return. That 4% T-bill rate becomes the first building block of your hurdle rate.
The Art and Science of Setting a Risk Premium
While the cost of capital gives you a firm foundation, the risk premium is much more fluid and specific to your fund's strategy. It’s the compensation for all the things that make a VC or PE investment a whole lot riskier than buying a government bond.
Several key factors shape this premium:
- Market Volatility: When the economy is shaky or public markets are a rollercoaster, perceived risk goes up, and so does the premium investors expect.
- Company Stage: The risk involved in an early-stage venture deal is worlds apart from a late-stage buyout. The earlier the stage, the higher the required premium.
- Liquidity Risk: LPs are committing their capital for 7-10 years, sometimes longer. The risk premium has to compensate them for not being able to touch that money.
One of the core valuation techniques used to assess an investment's potential—and therefore influence the fund's hurdle rate—involves understanding discounted cash flow (DCF) models. These models bake a discount rate directly into their calculations, which is meant to reflect all these combined risks. For many fund managers, juggling these complex variables means it's time to move past spreadsheets; many are turning to more powerful reporting solutions beyond Excel to automate and streamline the process.
Ultimately, the hurdle rate often ends up looking a lot like the Weighted Average Cost of Capital (WACC) plus this tailored risk premium. To put it in perspective, while the average WACC for S&P 500 companies was around 10.2% in 2023, it’s common to see VCs target much higher internal rates of return (IRRs)—often in the 15-25% range—to make sure their portfolio as a whole can comfortably clear the hurdle.
Let's See It In Action:
Imagine the current 10-year Treasury rate (our risk-free rate) is 4%.A PE fund manager looks at their strategy, the illiquidity, and the specific industry risks and decides that an 8% risk premium is fair.
Hurdle Rate = 4% (Cost of Capital) + 8% (Risk Premium) = 12%
This 12% is now the magic number. The fund has to deliver returns above this threshold before the GP gets to take any carried interest. It's the mechanism that ensures LPs are paid first for their patience and their risk.
The Hurdle Rate in a Real-World Scenario
Formulas are great, but the best way to understand the hurdle rate is to see it in action. Let’s walk through a practical example with a fictional firm, "Apex PE Partners," as they weigh a potential buyout of a mid-market manufacturing company. This simple story shows how the hurdle rate shapes every decision, from initial analysis to the final payout.
Setting the Bar for a New Deal
Apex starts its due diligence on the manufacturing target. The first thing they do is establish a baseline for their required return. They look at the current risk-free rate—what they could earn from a safe investment like government bonds—and see it’s sitting at 4%. This becomes the absolute floor for their calculation.
Of course, investing in a manufacturing company is far from risk-free. This particular target has some clear challenges, like a shaky supply chain and fierce competition. To account for these specific business and market risks, Apex's investment committee tacks on a healthy 8% risk premium.
Now they have a clear number to work with.
Hurdle Rate = 4% (Cost of Capital) + 8% (Risk Premium) = 12%
This 12% hurdle rate is now the official performance benchmark for this deal. It's the minimum annualized return the investment must deliver for it to be deemed a success and for Apex to collect its performance fee. Anything less is a failure.
From Projections to Payouts
With the 12% hurdle rate locked in, the deal team at Apex gets to work building their financial models. Their forecasts suggest that by streamlining operations and pushing into new markets, they could generate an Internal Rate of Return (IRR) of 18% over a five-year hold.
Since the projected 18% IRR is well above the 12% hurdle rate, the investment committee gives the deal the green light. That 6% gap between the expected return and the minimum threshold is where the real profit lies—it's the margin that will eventually generate carried interest for the firm's partners.
Let’s jump ahead five years. Apex exits the investment, and the actual realized IRR comes in at 19%—even better than they projected. Now, it's time to distribute the profits, and the fund's waterfall structure dictates the flow of cash:
- Return of Capital: First, the Limited Partners (LPs) get every dollar of their original investment back.
- Preferred Return: Next, the LPs receive an additional payout equal to a 12% annual return on their money for the entire investment period. The hurdle has been cleared.
- Carried Interest: Only after the LPs have been made whole and received their preferred return can Apex PE Partners (the GP) start taking its 20% carried interest from the remaining profits.
This shows that the hurdle rate isn't just a number crunched at the beginning of a deal. It’s a living mechanism that governs the flow of money and directly ties the GP's compensation to delivering real value for investors. For a deeper dive into how hurdle rates are applied in practical investment scenarios, explore a comprehensive private equity case study. This real-world application shows precisely how the hurdle rate aligns GP and LP interests.
How Hurdles Impact Fund Profits and LP Reporting
The hurdle rate isn't just an abstract benchmark; it's a critical mechanism that directly shapes how a fund’s profits are carved up and reported back to investors. Its biggest influence is on carried interest—the GP's performance fee—where a fundamental distinction between two structures changes everything: hard hurdles and soft hurdles.
Let's break down how each one works.
Hard Hurdle vs. Soft Hurdle
Think of a hard hurdle as a true performance barrier. The GP only earns their carry on profits generated above the hurdle rate. So, if the hurdle is set at 8% and the fund returns 12%, the GP's 20% carry is calculated only on that 4% of outperformance. It's a clean, straightforward split.
A soft hurdle, on the other hand, acts more like a trigger. Once the fund's return crosses the 8% threshold, the GP is entitled to their 20% carry on all profits, from the very first dollar. In our 12% return example, hitting 8.01% unlocks the GP's right to calculate their carry on the entire 12%.
This distinction has massive financial implications. To see just how different the outcomes can be, let's look at a hypothetical $100 million fund that generates $30 million in profit (a 30% return) with an 8% hurdle.
Hard Hurdle vs Soft Hurdle: A Comparison
As the table shows, the seemingly small difference in structure results in a significant increase in GP compensation under a soft hurdle model. This brings us to another key part of the equation.
The Role of Catch-Up Clauses
Most fund agreements don't stop there. They often include a catch-up clause designed to ensure the GP receives their full, negotiated carry. Here’s how it works: after LPs have received their initial capital back plus the preferred return, the next slice of profits is allocated 100% to the GP. This continues until the GP has "caught up" to their target 20% of total profits.
When paired with a soft hurdle, a catch-up clause can dramatically accelerate how quickly a GP gets paid. It's a powerful combination that LPs watch very closely.
The idea of a hurdle rate isn't new. It was honed by hedge funds back in the 1990s, where fixed thresholds of 6-8% became standard before performance fees kicked in. That practice has found a firm footing in private equity. Today, the Institutional Limited Partners Association's (ILPA) guidelines recommend an 8% preferred return, a standard adopted by 82% of LPs who collectively manage $2 trillion in assets.
To really get a feel for how these mechanics play out in a fund's distribution waterfall, this video offers a great visual explanation.
Why This All Matters for LP Reporting
These complex calculations are the very engine of investor communication. Every distribution notice sent to an LP has to show exactly how profits are being split according to the fund's waterfall model. There is zero room for error.
A single miscalculation can trigger an investor dispute, permanently damage a GP's reputation, and create a compliance nightmare. This is why transparent, accurate, and timely LP reporting is so crucial. Following ILPA guidelines for clear disclosure isn't just about best practices; it's about maintaining the trust that underpins the entire GP-LP relationship. For a deeper dive, check out our guide on how to improve LP reporting in venture capital.
How Automation Keeps Hurdle Rate Tracking Accurate and Compliant
If you've ever managed a private equity or venture capital fund, you know it's a marathon of complex calculations. Trying to track performance against a hurdle rate using spreadsheets is a huge operational burden, especially as you juggle multiple investments, capital calls, and distributions over a decade or more. Honestly, it's a recipe for human error.
One wrong formula in an IRR calculation or a busted waterfall model can snowball into a massive problem. These aren't just small mistakes; they create serious compliance risks and can completely shatter the trust you've built with your LPs. The moment investors start questioning the numbers, that crucial GP-LP relationship is on shaky ground.
Why Spreadsheets Fall Short
Let's be blunt: spreadsheets were never designed for the kind of dynamic, multi-layered financial modeling that modern fund management demands. They just don't have the built-in checks, audit trails, or real-time data flow needed for truly accurate and compliant reporting. Leaning on them is just asking for trouble.
This is exactly where a dedicated portfolio intelligence platform shifts from being just another tool to a core strategic asset. By bringing all your fund and portfolio company data into one place, these systems get rid of the fragmented files and version-control nightmares that are all too common with spreadsheet-based setups.
A purpose-built platform turns fund operations from a reactive, error-prone scramble into a proactive, data-driven discipline. It creates a single source of truth for everyone involved, ensuring accuracy and consistency all the way from deal sourcing to the final distribution.
The Real Power of Automation in Fund Management
Automating these critical calculations isn't a luxury; it's fundamental to keeping your investors confident and your operations running smoothly. A solid platform can take on the most complex parts of fund administration, which frees you up to focus on what you do best: creating value. For instance, the right portfolio management software offers capabilities that manual processes can't even begin to replicate.
Here's what that looks like in practice:
- Real-Time IRR Tracking: You can instantly see how the fund and individual deals are performing against your hurdle rate, with no need for manual updates.
- Automated Waterfall Calculations: You can accurately model even the most complicated distribution scenarios—including catch-up clauses and tiered hurdles—with just a few clicks.
- One-Click ILPA-Compliant Reporting: Generate professional, transparent, and precise reports that meet the high standards of institutional investors, building trust and ensuring you're always compliant.
At the end of the day, automating your hurdle rate tracking and reporting is about much more than convenience. It’s a cornerstone of good fund governance. It delivers the accuracy you need to stay compliant and the transparency required to build strong, lasting relationships with your investors.
Common Questions About Hurdle Rates
Even after you get the hang of the basics, a few practical questions almost always pop up for both fund managers and investors. Let's tackle some of the most common ones to clear up any lingering confusion between the theory and the real world.
Think of this as bridging the gap between the textbook definition and how things actually play out in a fund.
What Is the Difference Between a Hurdle Rate and IRR?
It’s easy to see why these two get mixed up, but they serve very different purposes.
The hurdle rate is a forward-looking target. It's the minimum acceptable return a fund must hit before the GPs can start earning their performance fee, or carried interest. It’s the bar you have to clear.
On the other hand, the Internal Rate of Return (IRR) is the actual, realized return the fund generates over its lifetime. This is a backward-looking metric that measures what really happened. For a GP to earn carry, the fund's final IRR has to beat the hurdle rate.
Simply put, the hurdle rate is the goal line you set at the start. The IRR is how far you actually ran.
Is a Higher Hurdle Rate Always Better for LPs?
You’d think so, but not always. On paper, a higher hurdle rate looks great for investors—it means the fund has to perform exceptionally well before the manager gets a slice of the profits.
The problem is, an unrealistically high hurdle can backfire. It might incentivize GPs to chase much riskier deals to have a shot at clearing that high bar, potentially putting the entire fund in a precarious position.
A widely accepted rate, like the standard 8%, strikes a healthy balance. It ensures managers are rewarded for strong performance while aligning everyone's interests without encouraging reckless investment behavior. The "right" rate really depends on the fund's specific strategy and the market it's operating in.
How Do Changing Interest Rates Affect Hurdle Rates?
Interest rates have a huge and direct impact. At its core, a hurdle rate is built on the idea of a "risk-free" return—what an investor could earn with zero risk, typically from government bonds.
When central banks hike interest rates, the return on those safe government bonds goes up. This raises the opportunity cost for LPs. Why would they lock up their money in a risky, illiquid venture fund if they can get a decent return from something much safer?
To stay competitive and attract capital in a high-interest-rate environment, GPs often need to set higher hurdle rates for their new funds. It’s a direct response to investors expecting a bigger reward for taking on bigger risks.
Stop wrestling with error-prone spreadsheets. Vestberry provides a single source of truth for your fund, automating IRR tracking, waterfall calculations, and LP reporting so you can focus on driving returns. See how our portfolio intelligence platform can strengthen investor trust and streamline your operations.